9 Adding a basemap in QGIS
Basemaps are a background map that will be used to help users understand where things are taking place - they give them a recognisable reference.
Working with the STATS19 data, it would be quite helpful to have a map where the roads are quite prominent!
9.1 The simplest way to get started
QGIS has one basemap built in - so let’s load that in first.
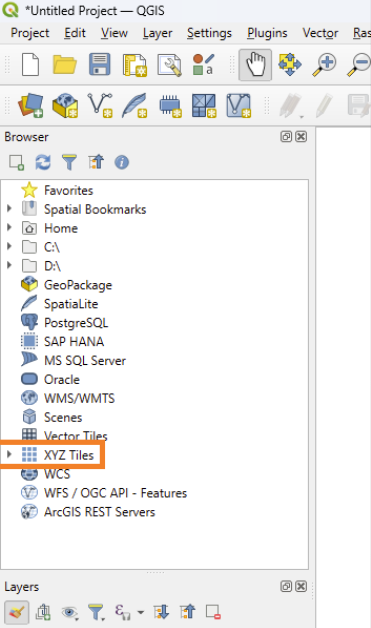
Look at the ‘Browser’ panel in QGIS, which will probably be on the left-hand side of your screen.
Click on the arrow next to ‘XYZ Tiles’
OR
Double click on the phrase ‘XYZ Tiles’
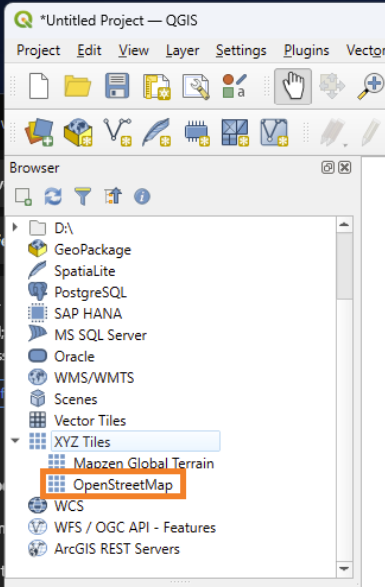
Now double click on ‘OpenStreetMap’
You should now be presented with a zoomed-out map of the world - if you’ve been reading this book in order, you may recognise the Mercator projection! If you’re interested, you can go back and brush up on projections in Chapter 4.
It’s important that you credit OpenStreetMap when sharing this map in any way, in accordance with its licencing terms.
The licencing text you need to include is this:
© OpenStreetMap contributors, licenced as CC BY-SA
You can stop reading here and move onto Chapter 10 if you like! There you will learn about importing a dataset of points.
However, if you want to use a different basemap to the default one provided by QGIS or are interested in learning about an alternate, less ‘busy’ looking basemap, then you can carry on to the sections below.
9.2 Using different basemap providers
By default, QGIS only offers OpenStreetMap basemap tiles.
However, you can easily load in additional tiles.
Make sure to appropriately credit the providers of any basemap services you use when sharing your maps, even internally!
To add new basemaps, right click on ‘XYZ Tiles’ in the Browser and select ‘New Connection…’.
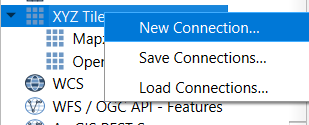
Here, you can give your new map tiles any name you like.
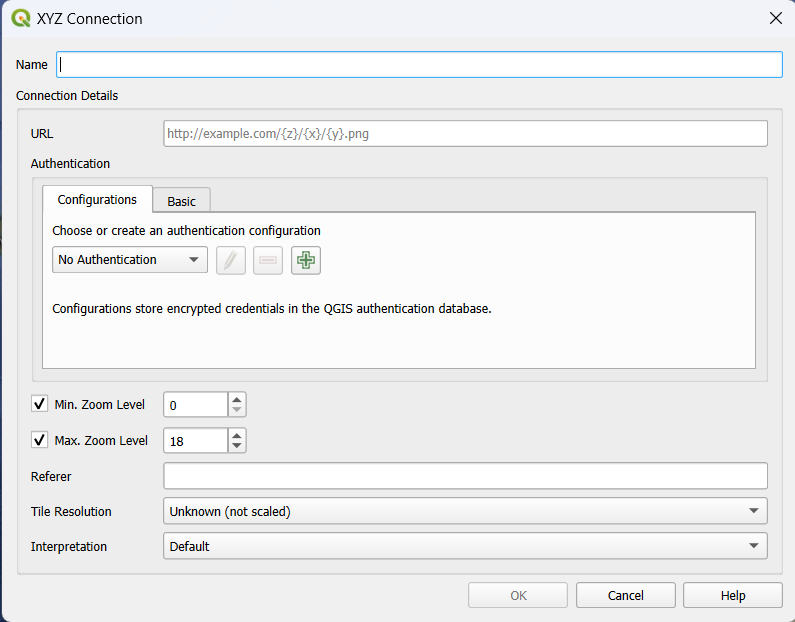
Under the URL setting, enter one of the following URLS^https://astro-geo-gis.com/liaison/qgis-tutorials/customizing-map-tiles-in-qgis/
Google Maps: http://mt1.google.com/vt/lyrs=m&x={x}&y={y}&z={z}

Google Hybrid (Satellite + Roads): https://mt1.google.com/vt/lyrs=y&x={x}&y={y}&z={z}
More tiles can be obtained by some careful searching! But note that many tiles will require a API key and may require payment to use, so you will likely want to stick to the default OpenStreetMaps in most cases.
9.3 Loading in a basic world map instead
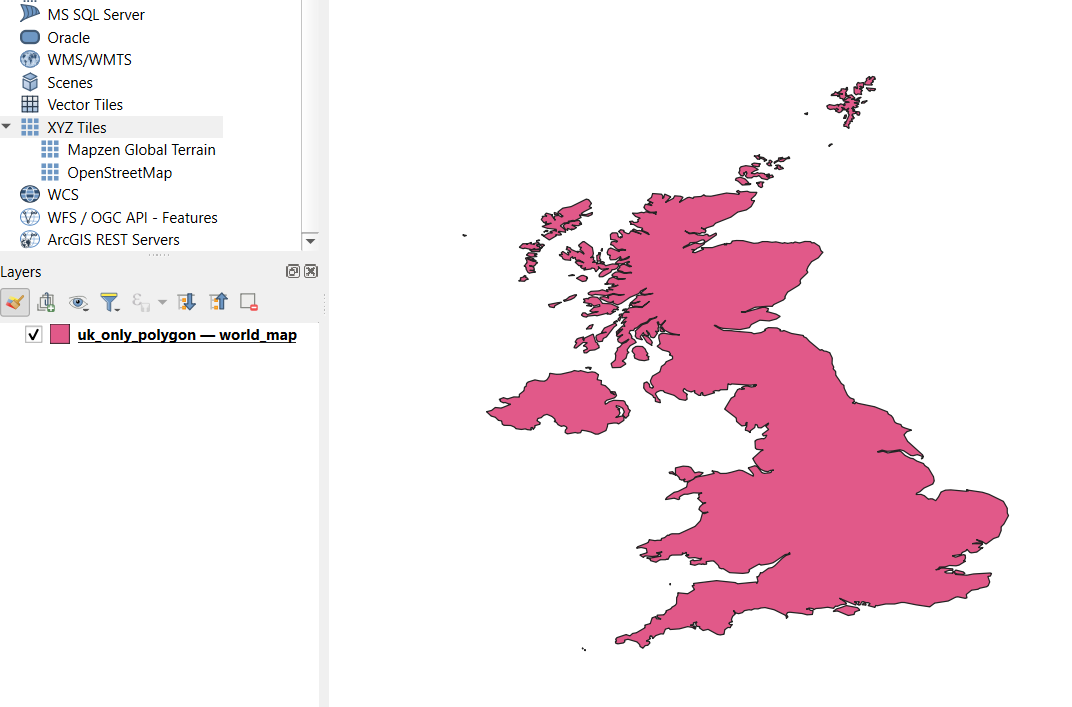
There are a few situations in which you might want to use the approach below instead, which will give you a nice plain basemap at the end of it, like the image below. - you want your data to be the star of the show - you don’t have an internet connection available to download the OpenStreetMap tiles - you can’t use the OpenStreetMap tiles due to licencing restrictions
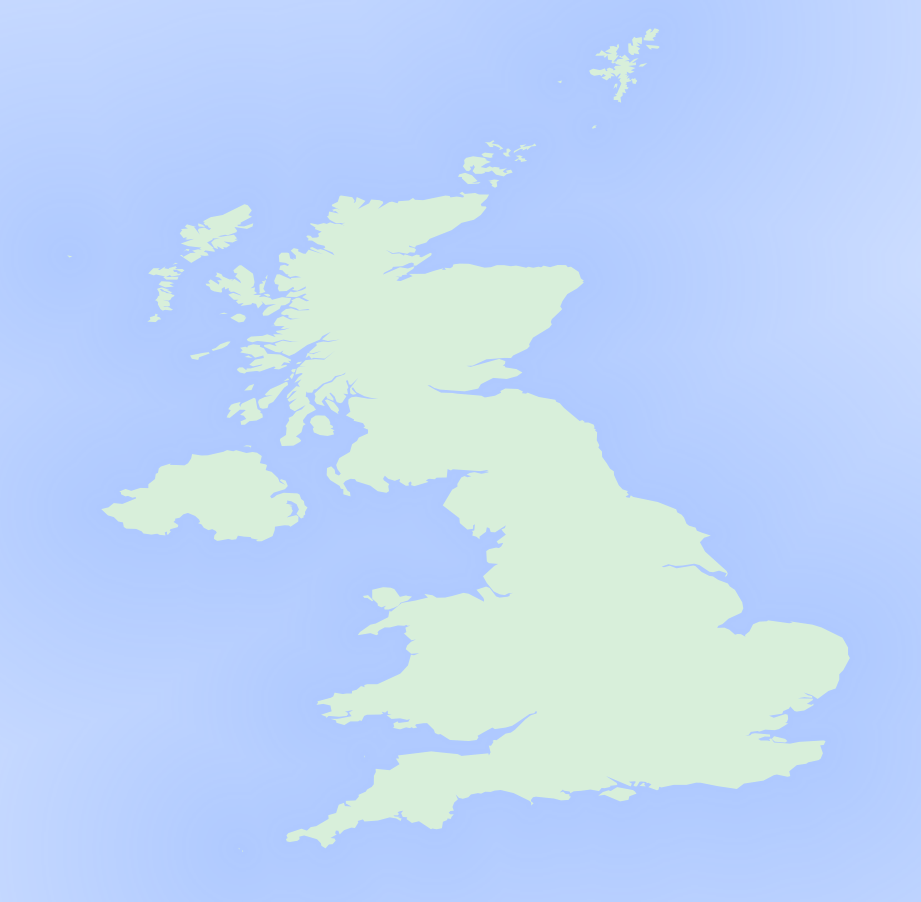
This method gives you a map outline that isn’t of a very high resolution - i.e. the areas don’t follow the outline of the UK precisely. It’s fine if you’re using the map at a fairly zoomed-out level, but it might not be so much use if you want to really zoom in to your county or a particular city!
Start a new project - you can either discard the changes to your previous project if you had a go at adding the OpenStreetMap basemap in, or you can save it somewhere for later.
Look at the very bottom of your QGIS window. Down at the bottom you should see a box that says ‘Coordinate’.
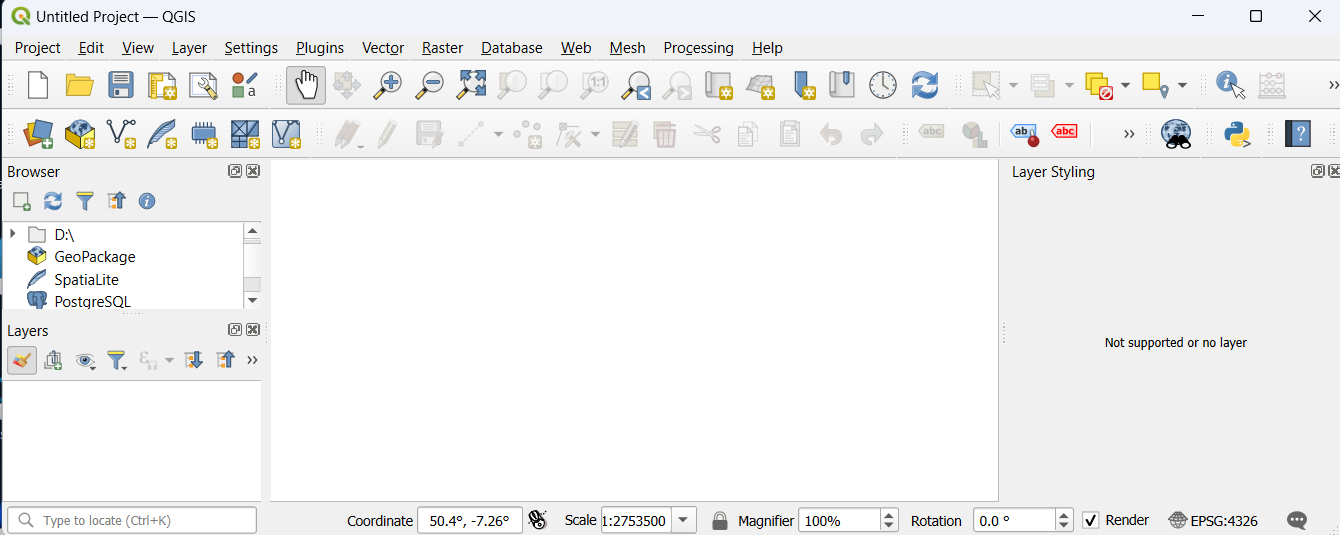
Normally this will show the coordinates of the point your mouse is hovering over.
However, we can click on this box and do a neat trick!
Click into the box and get rid of the coordinates - either by highlighting them and clicking ‘del’ or backspace to delete them all at once, or by clicking somewhere in the box and using a combination of those keys to get rid of any numbers and symbols.
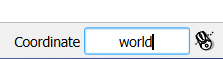
Enter ‘world’ into this box and click the ‘enter’ or ‘return’ key on your keyboard.
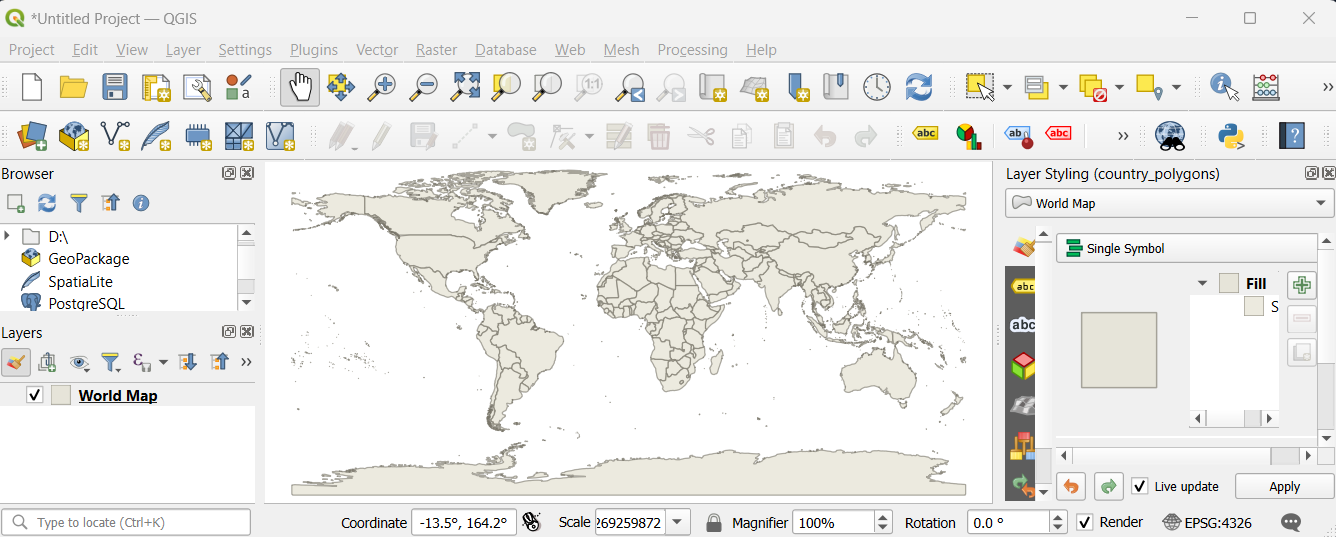
Voila! Suddenly you have a world map.
9.3.1 Cutting out unnecessary areas
For a lot of people on the HSMA course, you will only be interested in displaying data for the UK - or even just one nation within the UK.
This world map is split into different polygons.
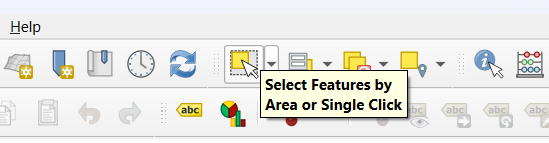
If we click on the ‘select features by area’ button on the top toolbar, we can select individual polygons.
Here I’ve selected only
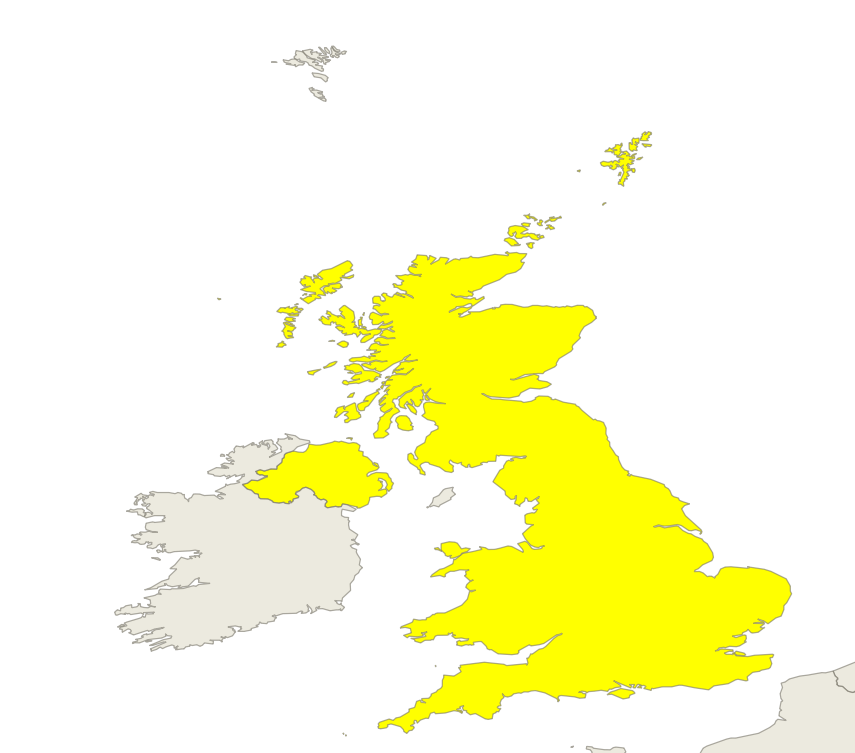
I can select additional areas by holding ‘shift’ and selecting an additional polygon. Here I’ve done this to select Ireland too.
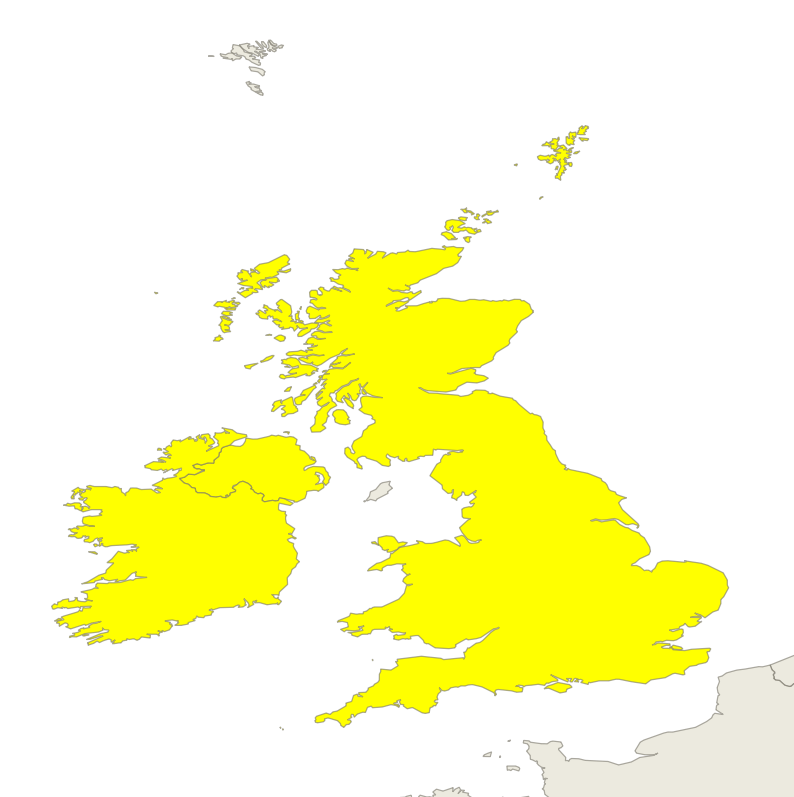
If I click on Ireland again with shift held down, it will be deselected. However, if I click on a selected polygon without shift held down, I will lose all my prior selections, and only the most recently clicked on polygon will be highlighted.
But just selecting these doesn’t do much. We can see that other areas are still visible.
If we head over to the layers panel, which is probably on the left of your screen, you can see that it has a layer called ‘world map’.
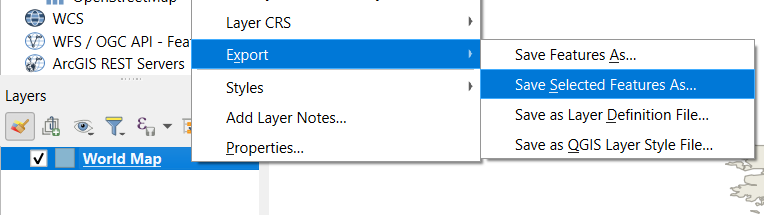
With the polygon(s) you are interested in selected, right click on the ‘world map’ layer and select ‘Save Selected Features As’.
This will bring up the following dialog box.
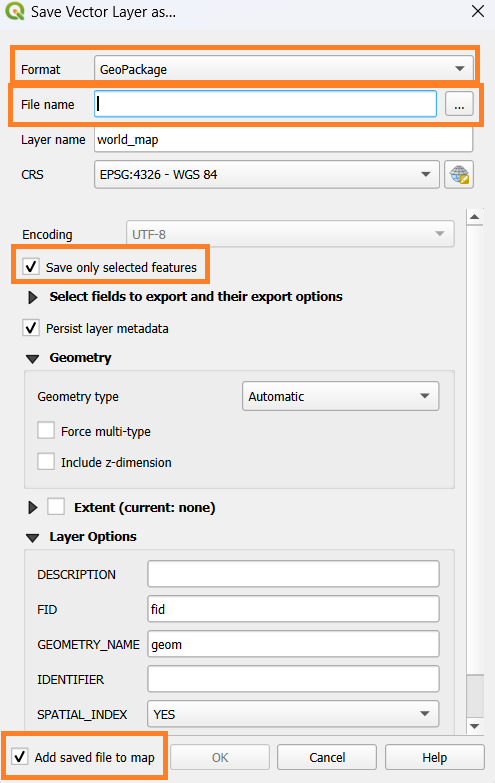
From the format box, you can select any of the options, but choosing ‘GeoPackage’ or ‘GeoJSON’ is a good idea as they output a single file that can be easily transferred into other software at a later date.
You can then enter a file name into the box below, which will be displayed in the next step, so make it something clear and useful. Clicking the three dots to the right of this box will open a standard operating system dialog box for saving the output file - but unusually, we don’t actually really care where it’s getting saved to! So you can really save it anywhere - though perhaps you might want to reuse this as a starting point in the future for different projects, so knowing where it’s gone could be handy.
So why aren’t we too worried about where it’s getting saved to? It’s because we’re interested in two other key things - the tickbox that says ‘Save only selected features’ and ‘Add saved file to map’.
Make sure those are checked, and then click ‘Ok’.
You’ll now see a second layer - with the name you entered in the previous step and a new randomly-chosen colour. .
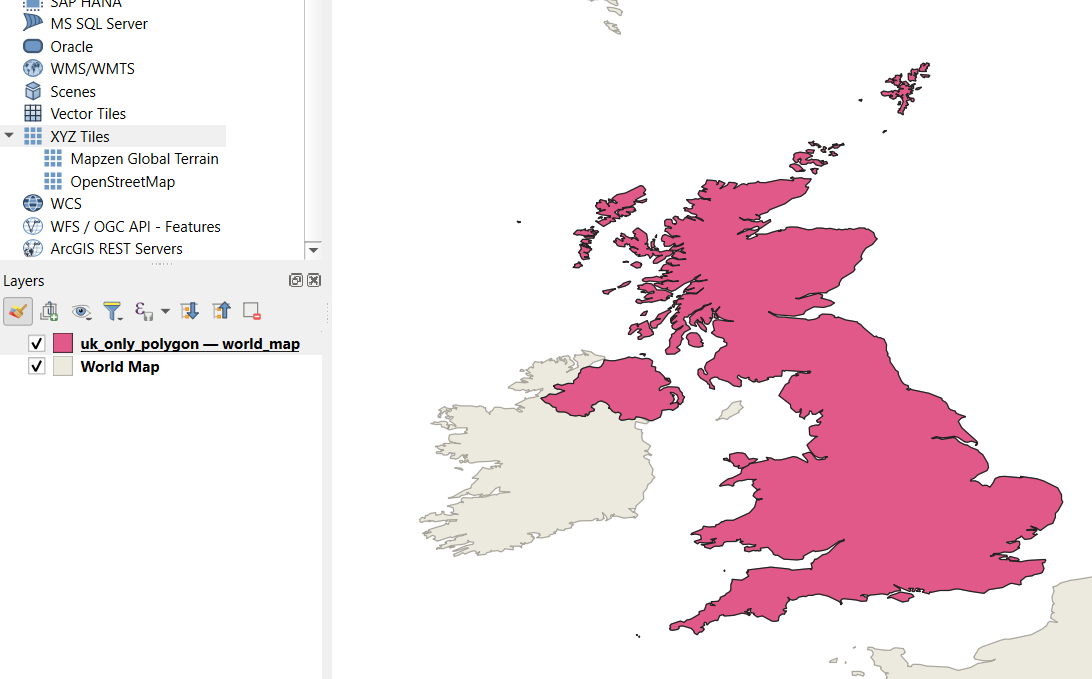
We can now untick the box next to the ‘World Map’ layer - or even right click and choose ‘Remove Layer’.
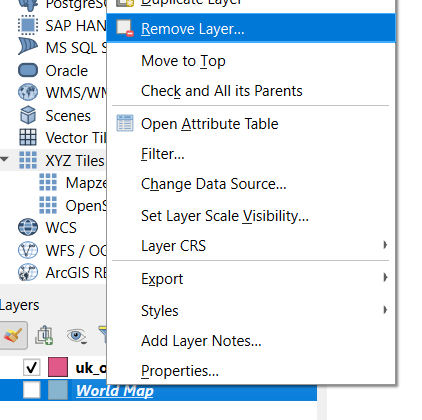
Now we’ll just have a nice outline of the UK to work with, which will be nice and efficient and clear for our final output.
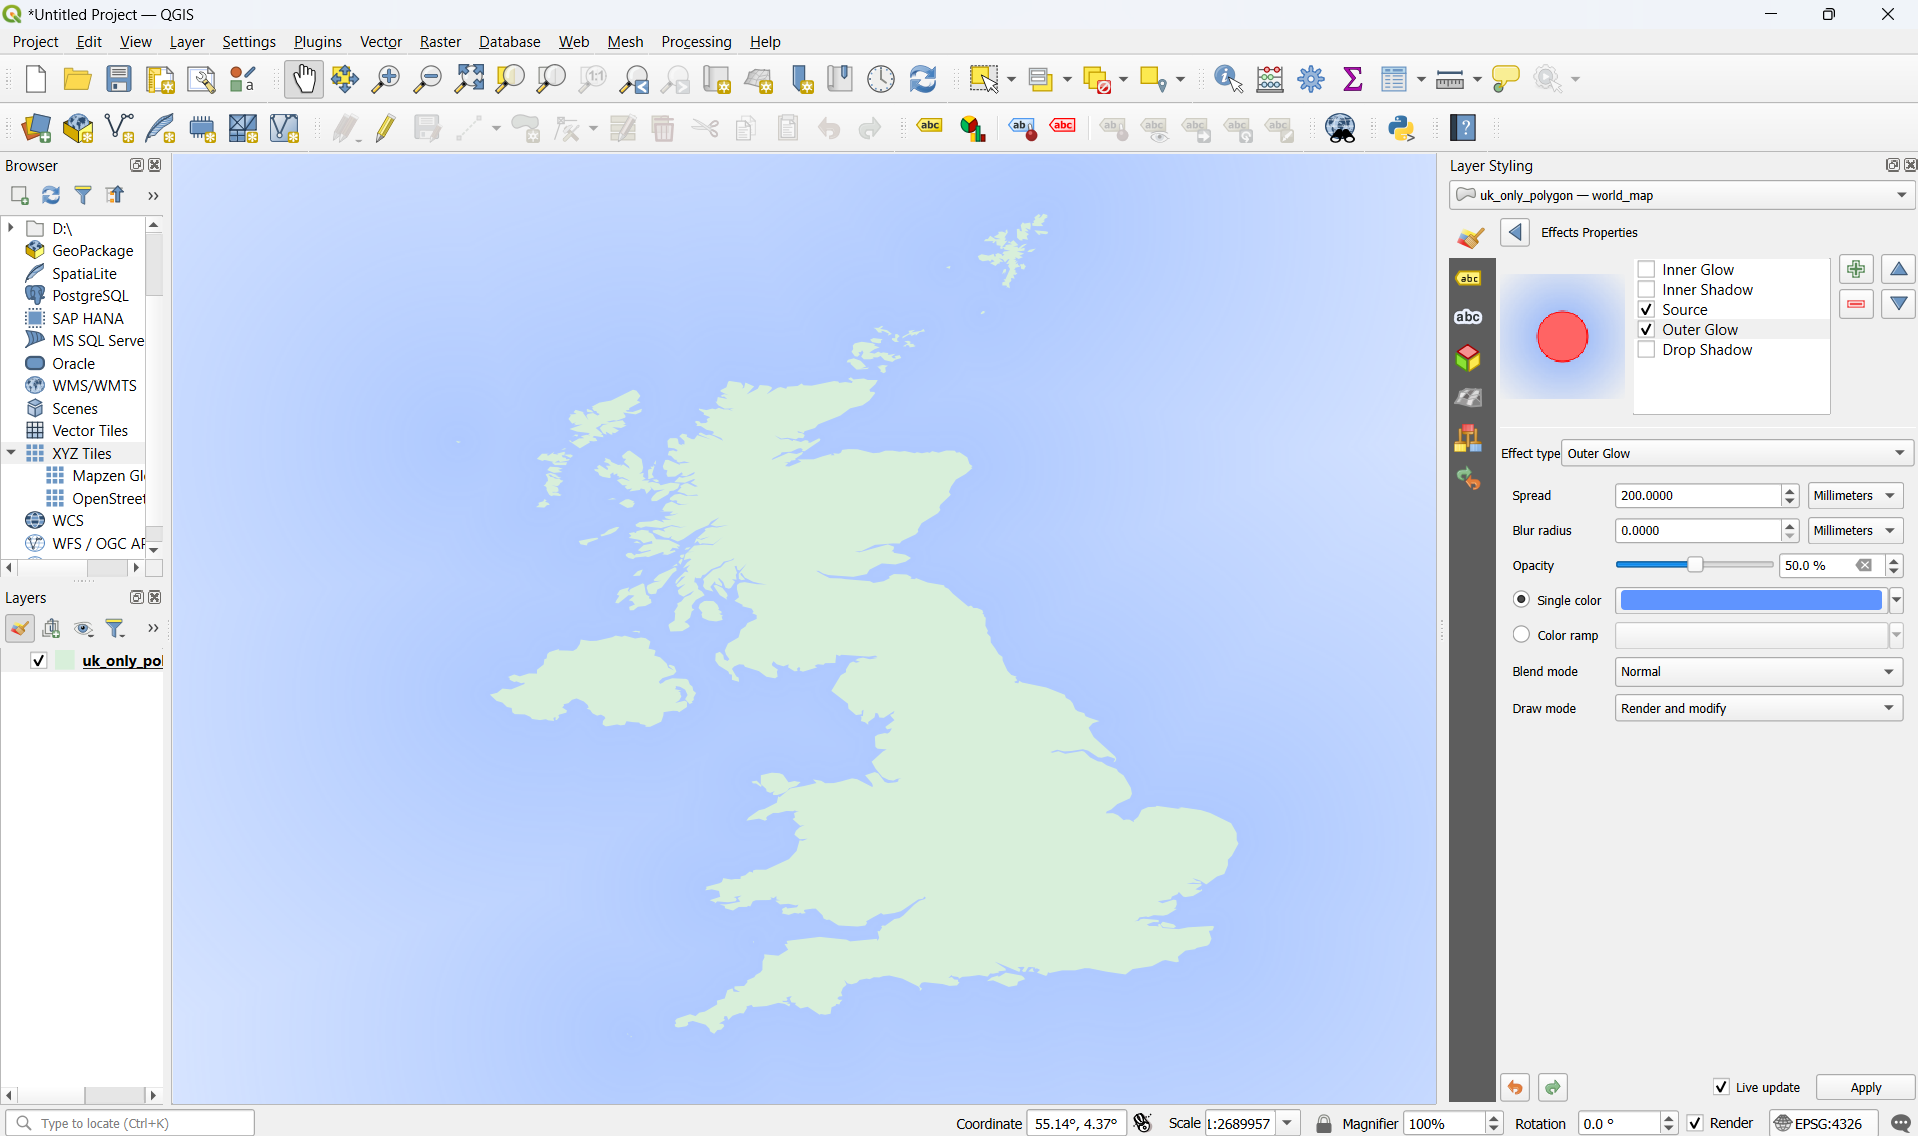
9.3.2 Styling our custom map
With our new layer selected - you can tell it’s selected because the name will have a grey background in the ‘Layers’ panel, and if it’s not selected you can click on the name of it in the ‘Layers’ panel - we then want to take a look at it in the Layer Styling Panel.
This panel isn’t visible by default. If you followed the setup steps in the previous chapted, this should be on the right of your screen.
If you didn’t, you can make it show up by clicking the “View” button in the top menu, then “Panels” and click on “Layer Styling” - this should make a tick appear next it and the panel will open up on the right side of the screen.
To start with, let’s change the background colour of the map.
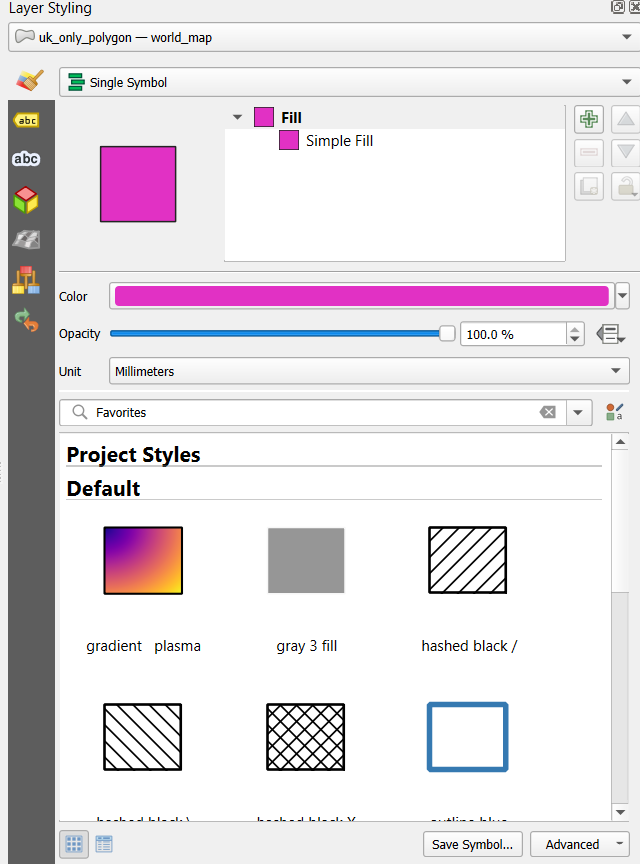
Clicking on the wide bar of colour with the label ‘Color’ brings up a colour picker.
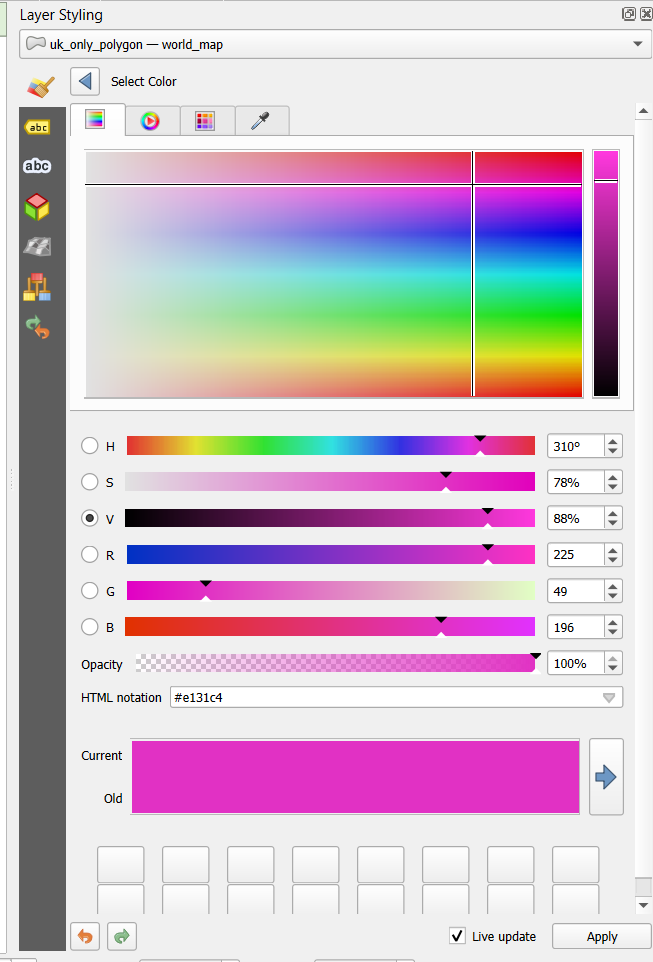
We can drag the crosshair to a nice pale green - or any colour you like!
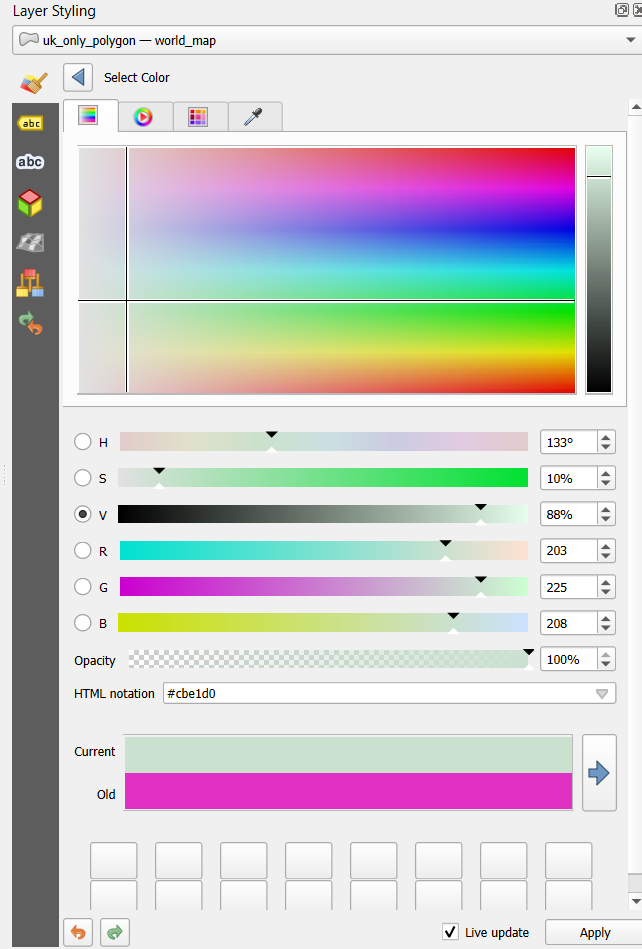
Then click on the back arrow next to ‘Select Color’, near the top of the layer styling panel, to get back to the previous screen.
Next, you’ll notice that we originally had ‘Fill’ selected. Click on ‘Simple Fill’ instead. It should show up by default, but if it doesn’t, click on the little black arrow to the left of the word ‘Fill’.
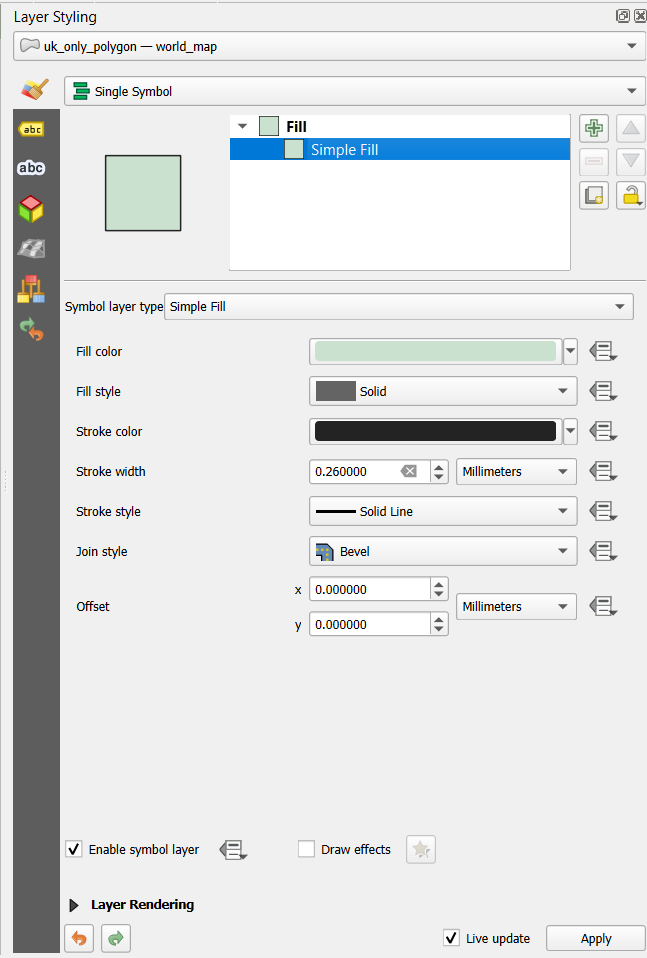
You can see thaat now we get some extra options available to us.
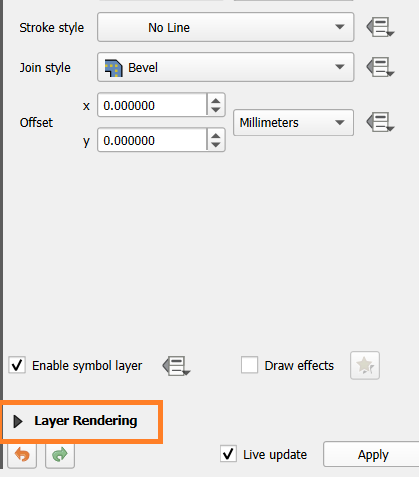
First, let’s get rid of the black outline by clicking the dropdown next to ‘Stroke style’ and choosing ‘No Line’.
Next, let’s add in a background colour.
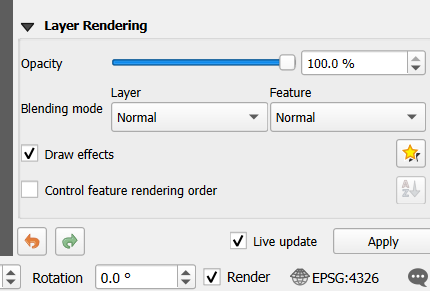
Click on the words ‘layer rendering’ towards the bottom of the layer styling panel.
Next, tick the box ‘Draw effects’ and click on the yellow star to the right to change the options.
Tick ‘Outer Glow’ and set the following options.
Spread = 200 Blur radius = 0 Single Color = Blue
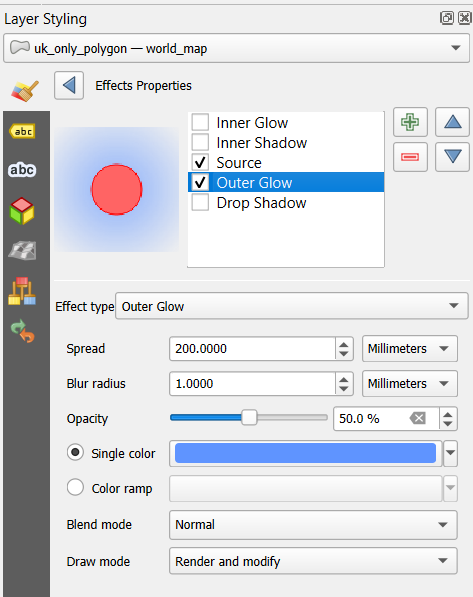
You now have a a nice plain UK map to work from!