17 Working With Travel Time Data in Python - the geopandas package
Pandas is a popular library for working with tabular data in Python.
Flat files like csvs or imported data from relational databases (e.g. SQL data warehouses) can be manipulated with pandas to add
A full introduction to pandas is outside of the scope of this book. However, a range of good tutorials exist.
PLACEHOLDER
However, standard pandas dataframes do not work well with key geographic data types. This is where the geopandas library comes in.
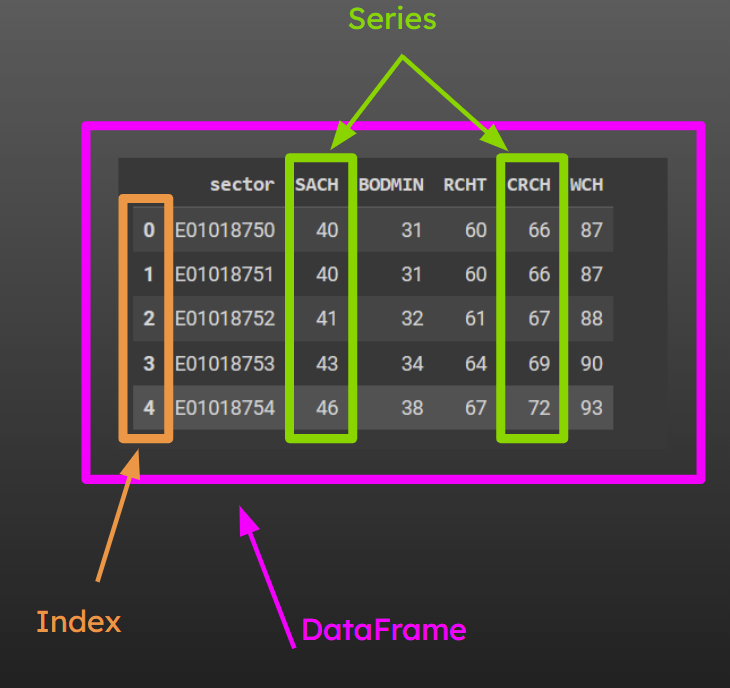
Pandas takes multiple series of data and joins these together to make a DataFrame.
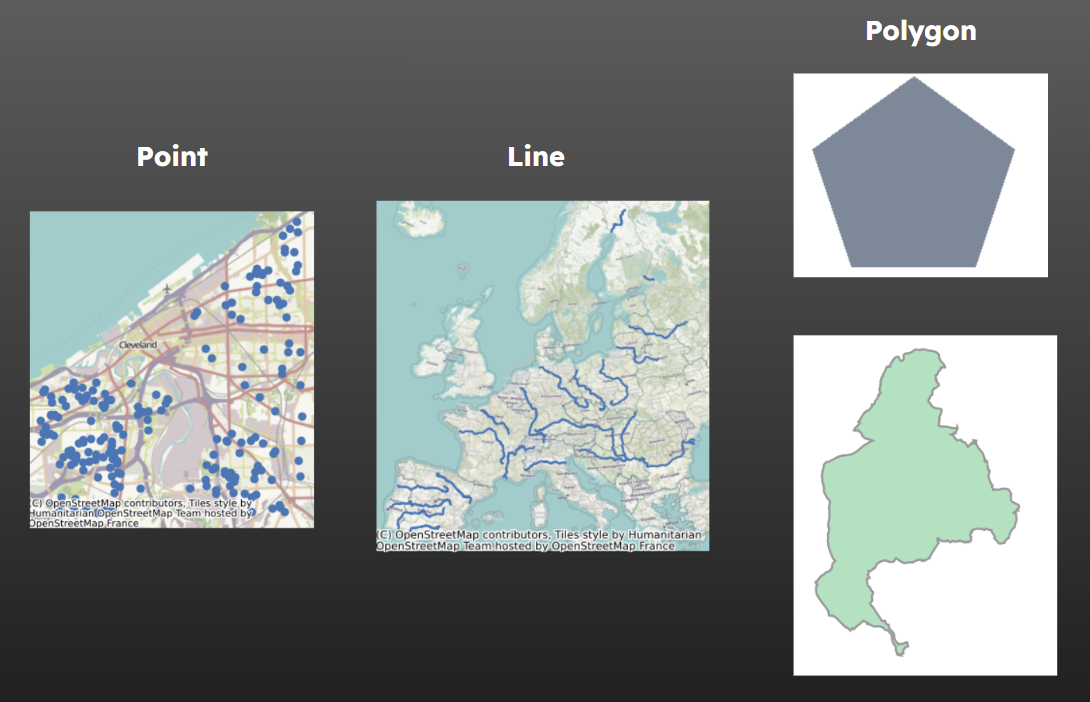
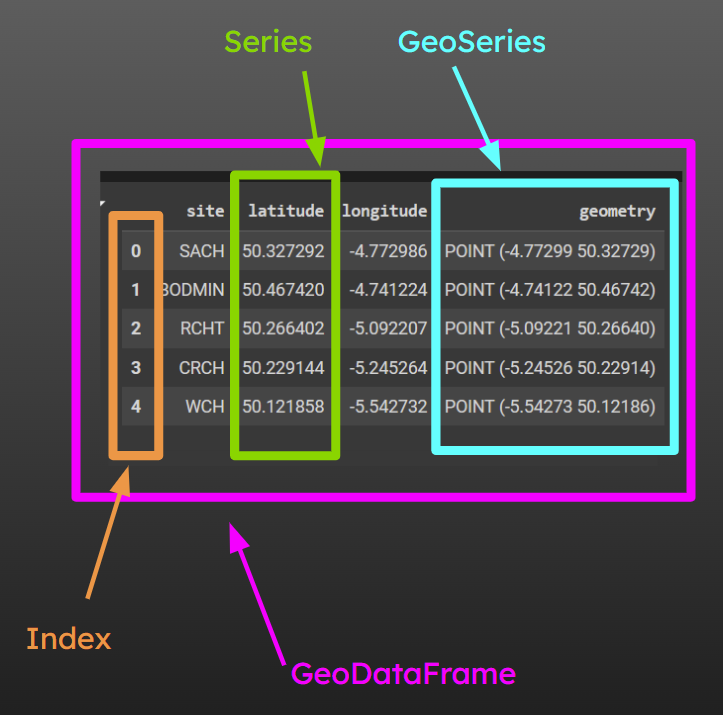
Geopandas takes the Series object of pandas and expands it to be able to deal with point, line or polygon data.
It adds in an ability to read various geographic data formats too, such as ESRI shapefiles, geopackages and geojson.
The magic of geopandas starts to become apparent when you need to filter and aggregate
You can even visualise geographic data that’s stored in a geopandas geodataframe with a single command: .plot()!
If you’re familiar with pandas, the good news is that working with geopandas will feel almost the same!
Geopandas is known for compatability issues with other packages.
If you install it into your base python environment, you may begin to experience odd behaviour or have issues [TODO: expand this section and get references]
17.1 The geometry column
Every Geopandas dataframe has a ‘geometry’ column (even if it’s not called that).
Various geopandas methods will then automatically apply to that geometry column without you having to specify that.
For example, the .plot() method of geopandas will plot the line, point or polygon data stored in the geometry column.