54 Chart types in matplotlib
There are lots of types of plots we can do with MatPlotLib.
Warning
Due to a bug, you may need to click into the plot space after running the code cell to make the plot appear.
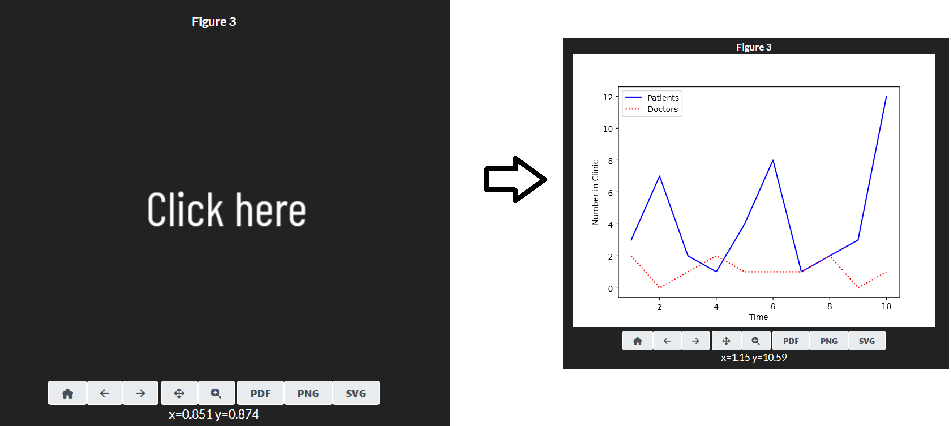
54.1 Line Chart
54.2 Bar Chart
54.3 Scatter Plot
54.4 More chart types
You can find sample code for a wide range of chart types in the matplotlib documentation.