import matplotlib.pyplot as plt53 An Introduction to Matplotlib
If we’re going to be building models or analysing data in Python, we’re likely going to want to plot graphs.
We could export the data and plot it elsewhere, but Python has very nice libraries for plotting. One of the most widely used is MatPlotLib, which is included in the Anaconda distribution of Python.
MatPlotLib offers powerful plotting features (including animated and interactive visualisations) and professional-looking plots.
However, just to slightly confuse things, historically it has had many different ways of doing exactly the same thing.
To minimise confusion, and because it is now the officially recommended approach, here we will teach you the Object Oriented approach to using MatPlotLib.
To import matplotlib, we use the following :
Tip
There are two objects in a MatPlotLib graph :
Figure – holds the graph (plotting area)
Axes – An axes object (not to be confused with an axis object) represents a subplot within a figure and is normally named ax.
Most of the time we’ll just have one axes object (that may have multiple lines / points plotted). For figures with multiple subplots (e.g. side by side, 4 in one figure etc), you’d need multiple axes objects (which we normally name axs) - see here for a simple tutorial : https://matplotlib.org/stable/users/explain/axes/axes_intro.html
53.1 Our first plot
Let’s start by plotting a basic line plot.
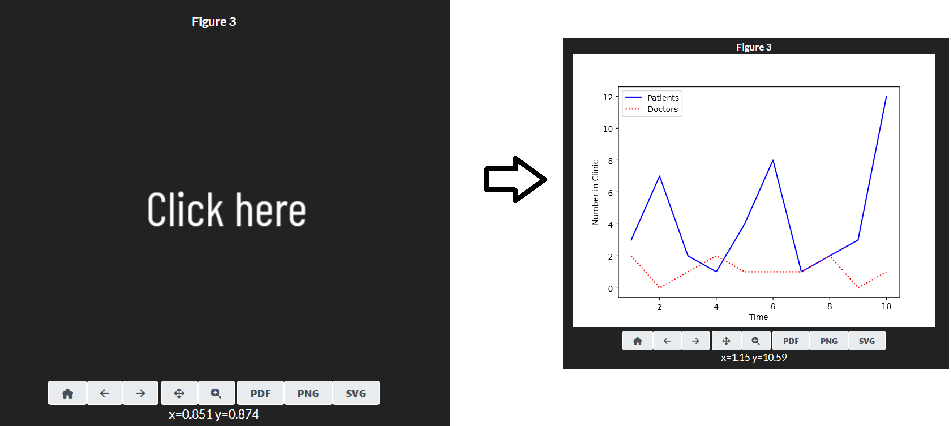
Warning
Due to a bug, you may need to click into the plot space after running the code cell to make the plot appear.
We can easily change the style of the line(s) we’re plotting by adding inputs to the plot method of the axes object.
53.2 Plotting Multiple Lines
Having different line styles is useful when we have multiple lines in the same plot.
It’s easy to add more lines - we just call the plot method of the axes object again.
53.3 Adding a legend
Adding a legend is also easy.
We just specify we want one, and add the label for each line when we call the plot method.
53.4 Exporting matplotlib charts
figure_1.savefig("figure_1.pdf")You can save it as a range of different file types.
figure_1.savefig("figure_1.png")And call it whatever you want!
figure_1.savefig("my_plot.jpeg")Or put it in a different location, like a subfolder.
figure_1.savefig("my_saved_plots/my_plot.jpeg")