Animaniacs

Bringing your simulations to life with vidigi

Sammi Rosser

Health Service Modelling Associates Programme

Introduction

If a picture is worth a thousand words…

… then an animation might be worth a lot more!

Benefits of animations


Helps
non-technical users understand what’s going on


Helps get people excited about your model


Helps with debugging

How do we create animations?

What is vidigi?

Vidigi is a package for creating animations of open-source discrete event simulations (like the ones you’ve been building in SimPy).

Who makes vidigi?


Us!

We’ve built it from the ground up with the intention of helping visualise health services.

So if anything isn’t working, or if there is a feature you need that doesn’t exist, the chances are we can sort that for you.


You and your projects can help shape the package!

Why Use Vidigi?

  • First dedicated library-agnostic animation solution for FOSS DES models
  • Built from a simple event log where your model logic stays unchanged
  • Interactive Plotly-based animations you can pause, fast-forward, rewind, and customise
  • Runs in common web application frameworks (e.g. Streamlit, Plotly Dash, Shiny), Quarto, or exports as a standalone file
  • Fast enough to re-run when users change parameters

Key Parts of Vidigi

What do you need?

Step 1

Add logging steps for arrivals, queues, resource use, and departures

Step 2

Set up a coordinate grid

Step 3

Set your animation parameters and generate your animation

EventLogger

Vidigi’s EventLogger class is the powerhouse of the whole shebang.

It allows us to record the key types of events that happen throughout the model.

Using EventLogger

We can import EventLogger from the utils module of vidigi like this.

from vidigi.utils import EventLogger

We then set up an instance of EventLogger like so.

my_logger = EventLogger(env=my_simpy_env)

I’ll talk about where we do that in our model a bit later.

Then we record different events like this.

my_logger.log_queue()

EventLogger’s Logging Types

Why EventLogger?

The Format Vidigi Expects


The EventLogger methods work with all of vidigi’s defaults, making it less likely that you’ll make errors when adding an animation in

Extra Plotting Helpers


Later, we’ll see other plots - not just animations - that EventLogger can automate for us

Your First Vidigi Animation - a Walkthrough

New Imports

First, we need a few new imports at the top of our file.

b_simple_one_step_model_vidigi.py

import simpy
from sim_tools.distributions import Exponential, Lognormal
import pandas as pd
from vidigi.logging import EventLogger  # NEW
from vidigi.utils import create_event_position_df, EventPosition  # NEW

Adding a Logging Class

The first thing we need to do is set up our logging class.

We will add this when initialising our Model class.

b_simple_one_step_model_vidigi.py

class Model:
    def __init__(self, param):
        self.param = param
        self.env = simpy.Environment()
        self.patient_counter = 0
        self.nurse = simpy.Resource(self.env, capacity=self.param.num_nurses)
        self.patient_inter_dist = Exponential(mean=self.param.mean_patient_inter)
        self.nurse_consult_time_dist = Lognormal(
            mean=self.param.mean_nurse_consult_time,
            stdev=self.param.sd_nurse_consult_time,
        )
        self.list_of_patients = []
        self.mean_q_time_nurse = pd.NA
        self.sd_q_time_nurse = pd.NA
        self.perc_90_q_time_nurse = pd.NA
        self.logger = EventLogger(env=self.env)  # NEW

Adding Logging Steps - Arrivals

We can now access our logger where we need it by calling self.logger.

We will place all of the logging steps in the .attend_clinic() method.

Let’s first add an arrival logging step!

b_simple_one_step_model_vidigi.py

def attend_clinic(self, patient):
    self.logger.log_arrival(entity_id=patient.id)  # NEW

Because we already gave our logger access to the SimPy env, it handles recording the time the event happened! So the only parameter we need to give our logger is an identifier for this patient, which they already record.

Adding Logging Steps - Queuing

We now record a queuing step with .log_queue()

This time, we also need to decide on a name for our event. This can be anything we like, though it’s good practice to use snake_case (i.e. lowercase with underscores instead of spaces).

b_simple_one_step_model_vidigi.py

def attend_clinic(self, patient):
    self.logger.log_arrival(entity_id=patient.id)

    start_q_nurse = self.env.now

    self.logger.log_queue(entity_id=patient.id, event="nurse_wait_begins")  # NEW

    with self.nurse.request() as req:
        yield req
        end_q_nurse = self.env.now
        ...

The simple way to record activity use

We’re going to start with the simplest way of logging that someone is being seen by the nurse - also treating it as a queue in vidigi’s language.

b_simple_one_step_model_vidigi.py

def attend_clinic(self, patient):
    ...
    with self.nurse.request() as req:
        yield req
        end_q_nurse = self.env.now
        self.logger.log_queue(entity_id=patient.id, event="being_seen_by_nurse")  # NEW
        patient.q_time_nurse = end_q_nurse - start_q_nurse

        sampled_nurse_act_time = self.nurse_consult_time_dist.sample()
        yield self.env.timeout(sampled_nurse_act_time)
        self.logger.log_queue(entity_id=patient.id, event="nurse_treatment_ends")  # NEW

But it’s not a queue?!

Later, we’ll look at vidigi’s more advanced ways of tracking resource use, but treating it as a ‘queue’ step for now allows us to get a simple animation up and running very quickly.

Adding Logging Steps - Departure

Finally, every patient needs one departure event.

b_simple_one_step_model_vidigi.py

def attend_clinic(self, patient):
    ...
    self.logger.log_departure(entity_id=patient.id)  # NEW


It’s important that each patient only has one arrival and one departure event per model run.

Things get messy if they don’t!

(So if there’s any way they can ‘leave and come back’ in your model, think carefully about how you’ll handle it…)

All the logging steps

Let’s recap the changes we made.

b_simple_one_step_model_vidigi.py

def attend_clinic(self, patient):
    self.logger.log_arrival(entity_id=patient.id)  # NEW

    start_q_nurse = self.env.now

    self.logger.log_queue(entity_id=patient.id, event="nurse_wait_begins")  # NEW

    with self.nurse.request() as req:
        yield req
        end_q_nurse = self.env.now
        self.logger.log_queue(entity_id=patient.id, event="being_seen_by_nurse")  # NEW
        patient.q_time_nurse = end_q_nurse - start_q_nurse

        sampled_nurse_act_time = self.nurse_consult_time_dist.sample()
        yield self.env.timeout(sampled_nurse_act_time)
        self.logger.log_queue(entity_id=patient.id, event="nurse_treatment_ends")  # NEW

    self.logger.log_departure(entity_id=patient.id)  # NEW

Accessing our event log

Once our model has run, our EventLogger is sitting on our model as my_model.logger.

We’ll want to look at the event log as a pandas dataframe, so we ask the logger to convert it for us with to_dataframe().

b_simple_one_step_model_vidigi.py

my_params = Param()
my_model = Model(my_params)
my_model.run_model()
...

print(my_model.logger.to_dataframe().head(10))

Vidigi’s to_dataframe() method will look at the EventLogger object, find where it stores the event logs, and convert it into this format for us.

Where does the animation code go?

Our models contain some key classes: Params, Patient, Model

(also Trial, but in this first example, we’re just working at the level of a single model - we’ll look at wiring Vidigi into Trial a bit later)

This time, we don’t need a new class. Vidigi’s animation function can be called directly, so our animation code goes at the bottom of our script, after our model has run.

b_simple_one_step_model_vidigi.py

my_params = Param()
my_model = Model(my_params)
my_model.run_model()
...
# Our animation code goes here!

Setting up a Layout Grid

The first thing we need for our animation is a layout grid.

b_simple_one_step_model_vidigi.py

EventPosition(
    event="nurse_wait_begins",
    x=200,
    y=250,
    label="Waiting for Nurse"
    )

For each event we want in our animation, we create an EventPosition object and pass four things:

  • the event name (which MUST match what we called it in the logger)
  • an x coordinate for the front of that queue
  • a y coordinate for the front of that queue
  • a nicer label for the event to display in the animation

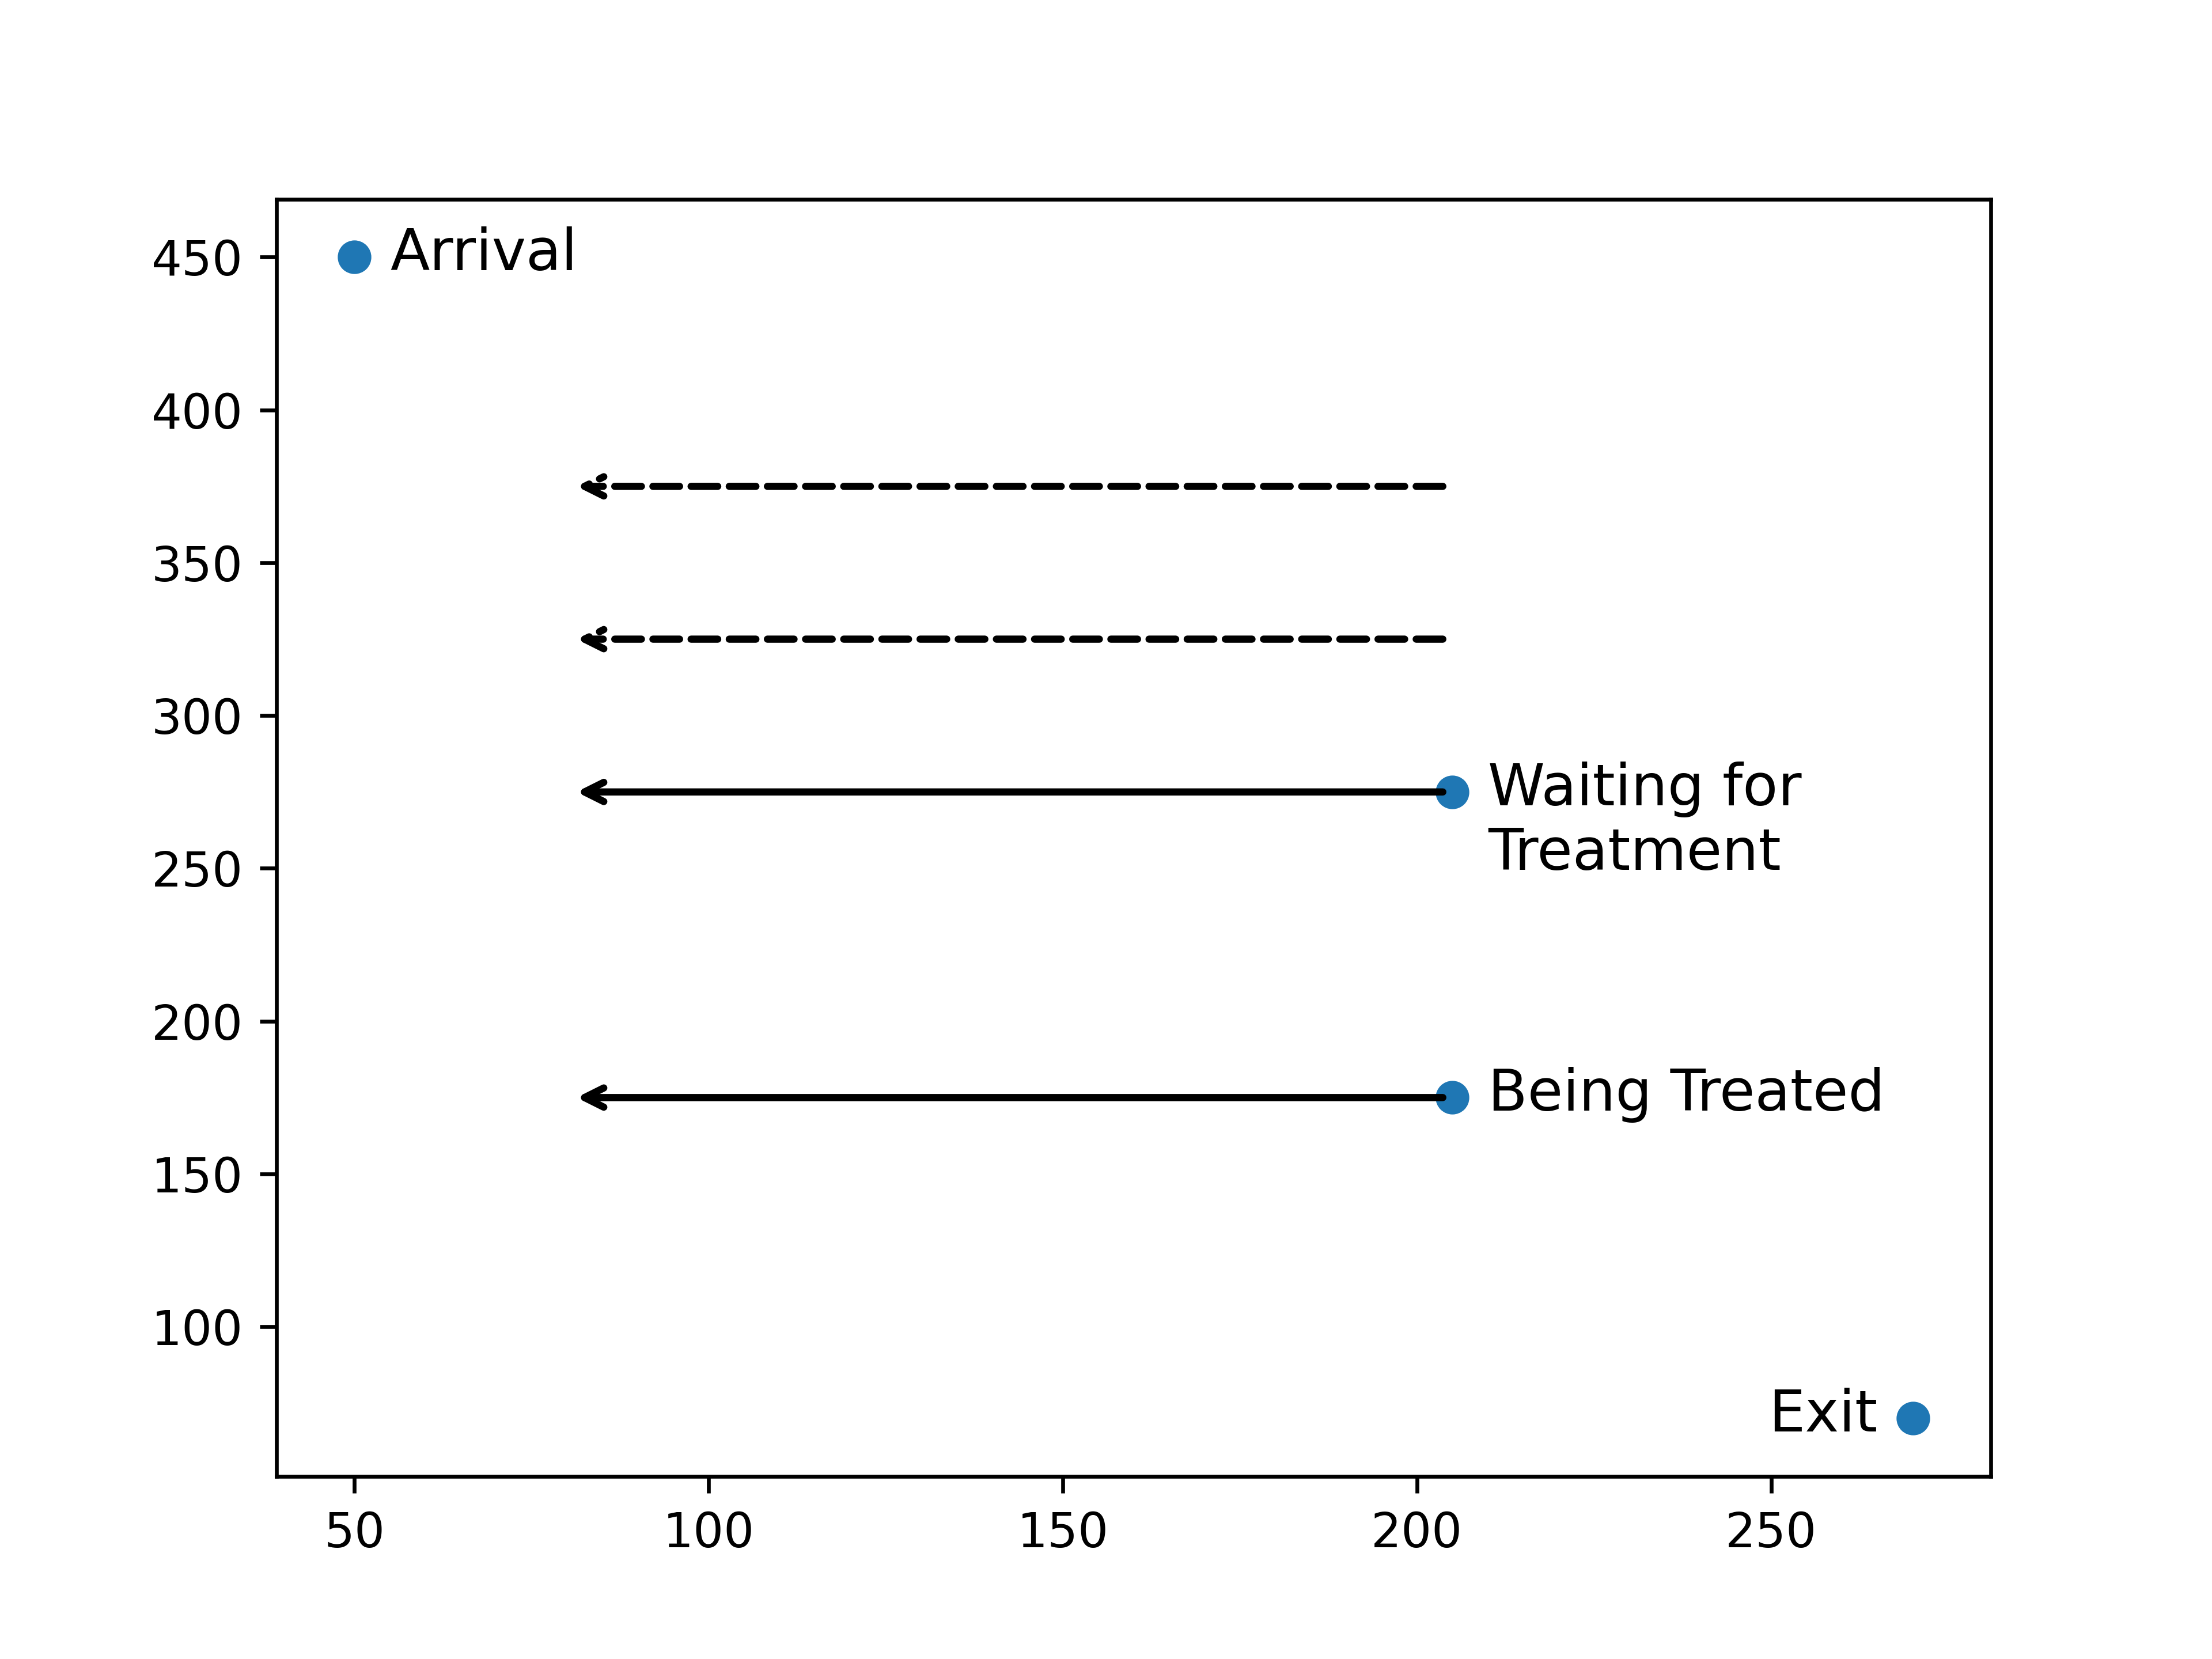
Queuing direction

In this example,

  • Arrival is at x=50, y=450
  • Waiting for treatment is at x=200, y=275
  • Being treated is at x=200, y=175
  • Exit is at x=275, y=25

Dotted lines show where the queue would wrap

Coordinates

Vidigi works out the position of every entity and resource based on those few positions you define

Placing Arrival and Departure Events

Behind the scenes, EventLogger always gives these the same event name if you use .log_arrival() and .log_departure().

.log_arrival() = “arrival”

b_simple_one_step_model_vidigi.py

EventPosition(
    event="arrival",
    x=0, y=350,
    label="Entrance"
)

.log_departure() = “depart”

b_simple_one_step_model_vidigi.py

EventPosition(
    event="depart",
    x=200, y=50,
    label="Exit"
)


create_event_position_df

We pass a list of all our EventPosition objects to the function create_event_position_df. Remember - a Python list uses [] with each item separated by a ,

b_simple_one_step_model_vidigi.py

create_event_position_df(
    [
        EventPosition(
            event="arrival", x=0, y=350, label="Entrance"
        ),
        EventPosition(
            event="nurse_wait_begins", x=200, y=250, label="Waiting for Nurse"
        ),
        EventPosition(
            event="being_seen_by_nurse", x=200, y=150, label="Being Seen By Nurse"
        ),
        EventPosition(
            event="depart", x=200, y=50, label="Exit"
        )
    ]
)

We don’t need to visualise the ‘nurse_treatment_ends’ step as the timing will be identical to the depart step.

The full Grid in situ

We’ll store this in a variable called layout, at the bottom of our script.

b_simple_one_step_model_vidigi.py

...

layout = create_event_position_df(
    [
        EventPosition(
            event="arrival", x=0, y=350, label="Entrance"
        ),
        EventPosition(
            event="nurse_wait_begins", x=200, y=250, label="Waiting for Nurse"
        ),
        EventPosition(
            event="being_seen_by_nurse", x=200, y=150, label="Being Seen By Nurse"
        ),
        EventPosition(
            event="depart", x=200, y=50, label="Exit"
        )
    ]
)

Generating the Animation

Now, we just need to ask our logger to generate the animation for us, using vidigi’s animate_activity_log().

We pass it our layout, and how often we want a frame in our animation - here, one frame for every 1 minute of simulated time.

b_simple_one_step_model_vidigi.py

...
layout = create_event_position_df(...)

fig = my_model.logger.animate_activity_log(
    event_position_df=layout,
    every_x_time_units=1,
)

fig.show()

The event log

ⓘentity_id event_type event time
1arrival_departurearrival0.000000
1queuenurse_wait_begins0.000000
1queuebeing_seen_by_nurse0.000000
2arrival_departurearrival0.519591
2queuenurse_wait_begins0.519591
1queuenurse_treatment_ends5.891559
1arrival_departuredepart5.891559
2queuebeing_seen_by_nurse5.891559
2queuenurse_treatment_ends12.633380
2arrival_departuredepart12.633380
(90 more rows not shown)

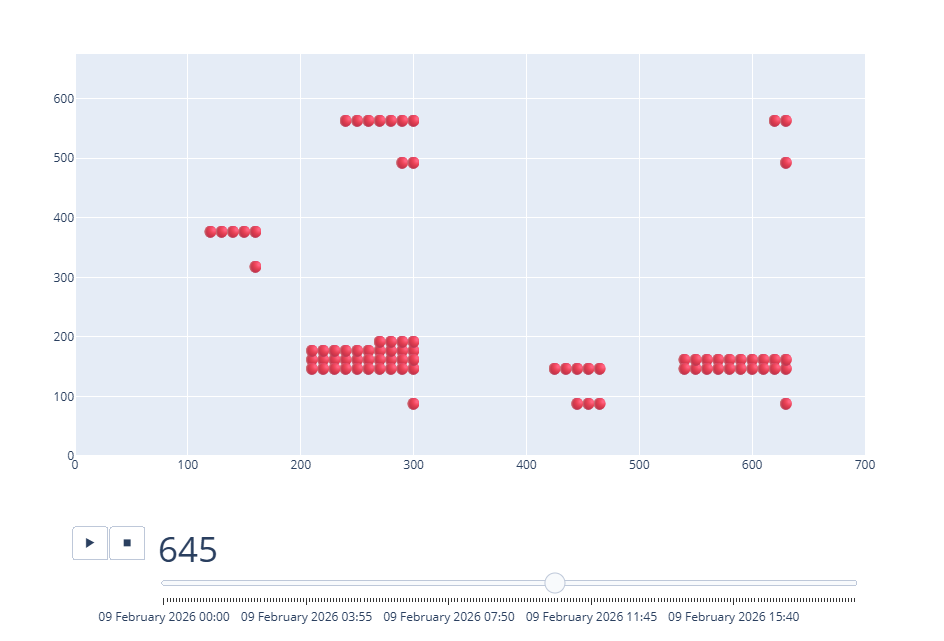
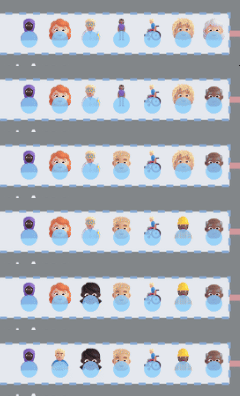
The animation

Advanced Vidigi Elements: Resources

Why is Resource Use Different to Queues?

So far, we’ve used a queue for resource use

And this works, but has a couple of downsides…

  • People move through the resource use step like a queue rather than staying with a single resource
  • You can’t see resources that aren’t being used, so it’s difficult to tell whether the system is underutilising resources

(you can usually tell if it’s over capacity because a queue will be building up!)

Resource use allows us to fix this

What do we change?

We don’t have to change too much!

  1. We will swap in a custom resource class instead of Simpy.Resource
  1. We will set up automated logging of our resource use events - vidigi captures the ID of the resource used for us
  1. We will tell our layout which resource to draw, and pass our params to our animation code (so it knows how many resources there are)

Custom Resource Classes

Vidigi provides two key custom resource classes

VidigiStore

Equivalent to simpy.Resource

VidigiPriorityStore

Equivalent to simpy.PriorityResource

We don’t want to use VidigiResource.

This is a special class that Vidigi uses internally, and by itself it won’t allow us to track the resource ID in the way we need to.

Why do we need these?

Let’s imagine we have two nurses.

SimPy resources don’t really have a concept of separate nurses behind the scenes.

The VidigiStore approach

In contrast, a VidigiStore is filled with individual nurses, each with their own ID.

If vidigi knows the ID of a resource, it ensures that people are assigned to the right resource in the animation for the whole time they are using it.

Adding Resource Use to Vidigi Animations

To recap, we’re going to

  1. swap in a custom resource class instead of Simpy.Resource
  2. set up automated logging of our resource use events
  3. tell our layout which resource to draw, and pass our params to our animation code (so it knows how many resources there are).

1a. Import the new resource class

First, we need to make sure we have imported our new class.

c_simple_one_step_model_vidigi_resources.py

from vidigi.resources import VidigiStore


Note

We could instead use

import vidigi

And then

vidigi.resources.VidigiStore

whenever we want to use it, but the vidigi documentation uses the convention detailed above

1b. Swap in the new resource class instead of Simpy.Resource

Before

b_simple_one_step_model_vidigi.py

class Model:
    def __init__(self, param):
        ...
        self.nurse = simpy.Resource(self.env, capacity=self.param.num_nurses)

After

c_simple_one_step_model_vidigi_resources.py

class Model:
    def __init__(self, param):
        ...
        self.logger = EventLogger(env=self.env)

        self.nurse = VidigiStore(
            self.env,
            num_resources=self.param.num_nurses,
            logger=self.logger,
            label="nurse",
        )
  • We change simpy.Resource to VidigiStore
  • We change ‘capacity’ to ‘num_resources’ (as capacity has its own special meaning in vidigi’s resources)
  • We add a label to our resource so we can more clearly differentiate between different pools of resources in our logs
  • We pass our logger to the resource - so we need to create the logger first, which is why it has moved above the resource

2. Capture the entity ID for resource logging

Before

b_simple_one_step_model_vidigi.py

def attend_clinic(self, patient):
        ...
        self.logger.log_queue(entity_id=patient.id, event="nurse_wait_begins")

        with self.nurse.request() as req:
            yield req

We need to tweak our request to pass in

  • the ID for our patient so that the automated logging can associate each resource use with the correct patient.
  • the names we want to use for our events (when the resource starts getting used, and when they finish using it)

After

c_simple_one_step_model_vidigi_resources.py

def attend_clinic(self, patient):
        ...
        self.logger.log_queue(entity_id=patient.id, event="nurse_wait_begins")

        with self.nurse.request(  # UPDATED
            entity_id=patient.id,
            start_event="being_seen_by_nurse",
            end_event="nurse_treatment_ends",
        ) as req:
            yield req

3a. Remove any placeholder queue events

We can now remove the log_queue temporary events we put in place

def attend_clinic(self, patient):
    self.logger.log_arrival(entity_id=patient.id)

    start_q_nurse = self.env.now

    self.logger.log_queue(
        entity_id=patient.id, event="nurse_wait_begins"
        )

    with self.nurse.request(
        entity_id=patient.id,
        start_event="being_seen_by_nurse",
        end_event="nurse_treatment_ends",
    ) as req:
        yield req

        end_q_nurse = self.env.now
        self.logger.log_queue(
            entity_id=patient.id, event="being_seen_by_nurse"
            )
        patient.q_time_nurse = end_q_nurse - start_q_nurse

        sampled_nurse_act_time = self.nurse_consult_time_dist.sample()
        yield self.env.timeout(sampled_nurse_act_time)
        self.logger.log_queue(
            entity_id=patient.id, event="nurse_treatment_ends"
            )

    self.logger.log_departure(entity_id=patient.id)
def attend_clinic(self, patient):
    self.logger.log_arrival(entity_id=patient.id)

    start_q_nurse = self.env.now

    self.logger.log_queue(
        entity_id=patient.id, event="nurse_wait_begins"
        )

    with self.nurse.request(
        entity_id=patient.id,
        start_event="being_seen_by_nurse",
        end_event="nurse_treatment_ends",
    ) as req:
        yield req

        end_q_nurse = self.env.now
        patient.q_time_nurse = end_q_nurse - start_q_nurse

        sampled_nurse_act_time = self.nurse_consult_time_dist.sample()
        yield self.env.timeout(sampled_nurse_act_time)

    self.logger.log_departure(entity_id=patient.id)

SUMMARY: our full revised attend_clinic() method

c_simple_one_step_model_vidigi_resources.py

def attend_clinic(self, patient):
    self.logger.log_arrival(entity_id=patient.id)

    start_q_nurse = self.env.now

    self.logger.log_queue(entity_id=patient.id, event="nurse_wait_begins")

    with self.nurse.request(
        entity_id=patient.id,
        start_event="being_seen_by_nurse",
        end_event="nurse_treatment_ends",
    ) as req:
        yield req

        end_q_nurse = self.env.now
        patient.q_time_nurse = end_q_nurse - start_q_nurse

        sampled_nurse_act_time = self.nurse_consult_time_dist.sample()
        yield self.env.timeout(sampled_nurse_act_time)

    self.logger.log_departure(entity_id=patient.id)

4a. Tell our layout which resource to draw

c_simple_one_step_model_vidigi_resources.py

layout = create_event_position_df(
    [   ...
        EventPosition(
            event="being_seen_by_nurse", x=200, y=150, label="Being Seen By Nurse",
            resource="num_nurses",  # NEW
        ),
        EventPosition(event="depart", x=200, y=50, label="Exit"),
    ]
)

When we pass the resource name, this will be looked up from the params we pass to our animation (next slide), so we need to make sure the name exactly matches how it’s written in our Param class

We still don’t need to visualise the ‘nurse_treatment_ends’ step!

c_simple_one_step_model_vidigi_resources.py

class Param:
  def __init__(self, ..., num_nurses=1, ...):
      ...
      self.sd_nurse_consult_time = sd_nurse_consult_time
      self.num_nurses = num_nurses
      self.sim_duration = sim_duration
      ...

4b. Pass our params to our animation

We’re going to override the number of nurses in our params so we can more clearly see what’s going on.

c_simple_one_step_model_vidigi_resources.py

my_params = Param(num_nurses=2)  # NEW
my_model = Model(my_params)
my_model.run_model()

Then, we need to pass this params class to the scenario argument in .animate_activity_log().

c_simple_one_step_model_vidigi_resources.py

fig = my_model.logger.animate_activity_log(
    event_position_df=layout,
    every_x_time_units=1,
    scenario=my_params,  # NEW
)

This scenario is where vidigi looks up num_nurses to find out how many nurse icons to draw.

The event log

Our event log now has a new resource_id column and a ‘unique_resource_id’ that pulls in the label we added to our VidigiStore.

ⓘentity_id event_type event time resource_id unique_resource_id
1arrival_departurearrival0.000000NaNNaN
1queuenurse_wait_begins0.000000NaNNaN
1resource_usebeing_seen_by_nurse0.0000001.0nurse_1
2arrival_departurearrival0.931620NaNNaN
2queuenurse_wait_begins0.931620NaNNaN
2resource_usebeing_seen_by_nurse0.9316202.0nurse_2
3arrival_departurearrival5.025426NaNNaN
3queuenurse_wait_begins5.025426NaNNaN
1resource_use_endnurse_treatment_ends5.2231961.0nurse_1
1arrival_departuredepart5.223196NaNNaN
(136 more rows not shown)

The animation

And our animation now shows icons for each resource and people stay in place with the correct resource throughout.

Showcase

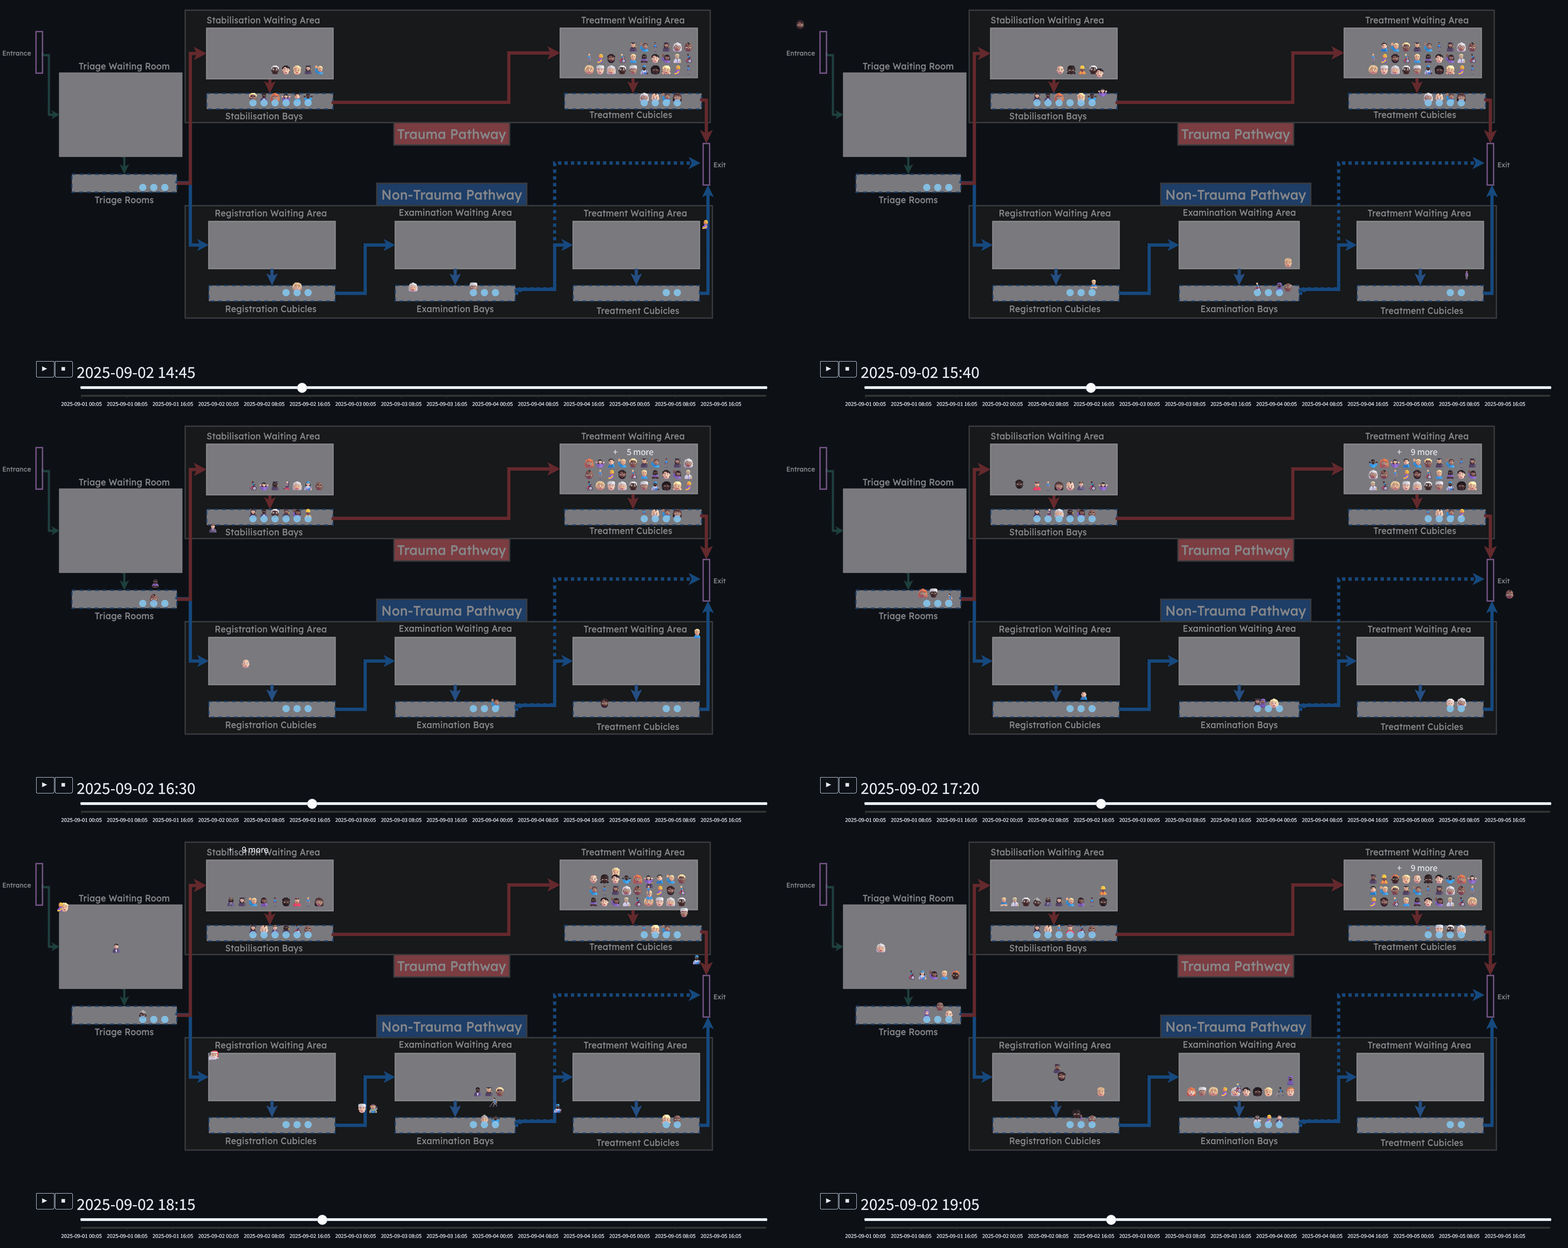
Advanced Animations

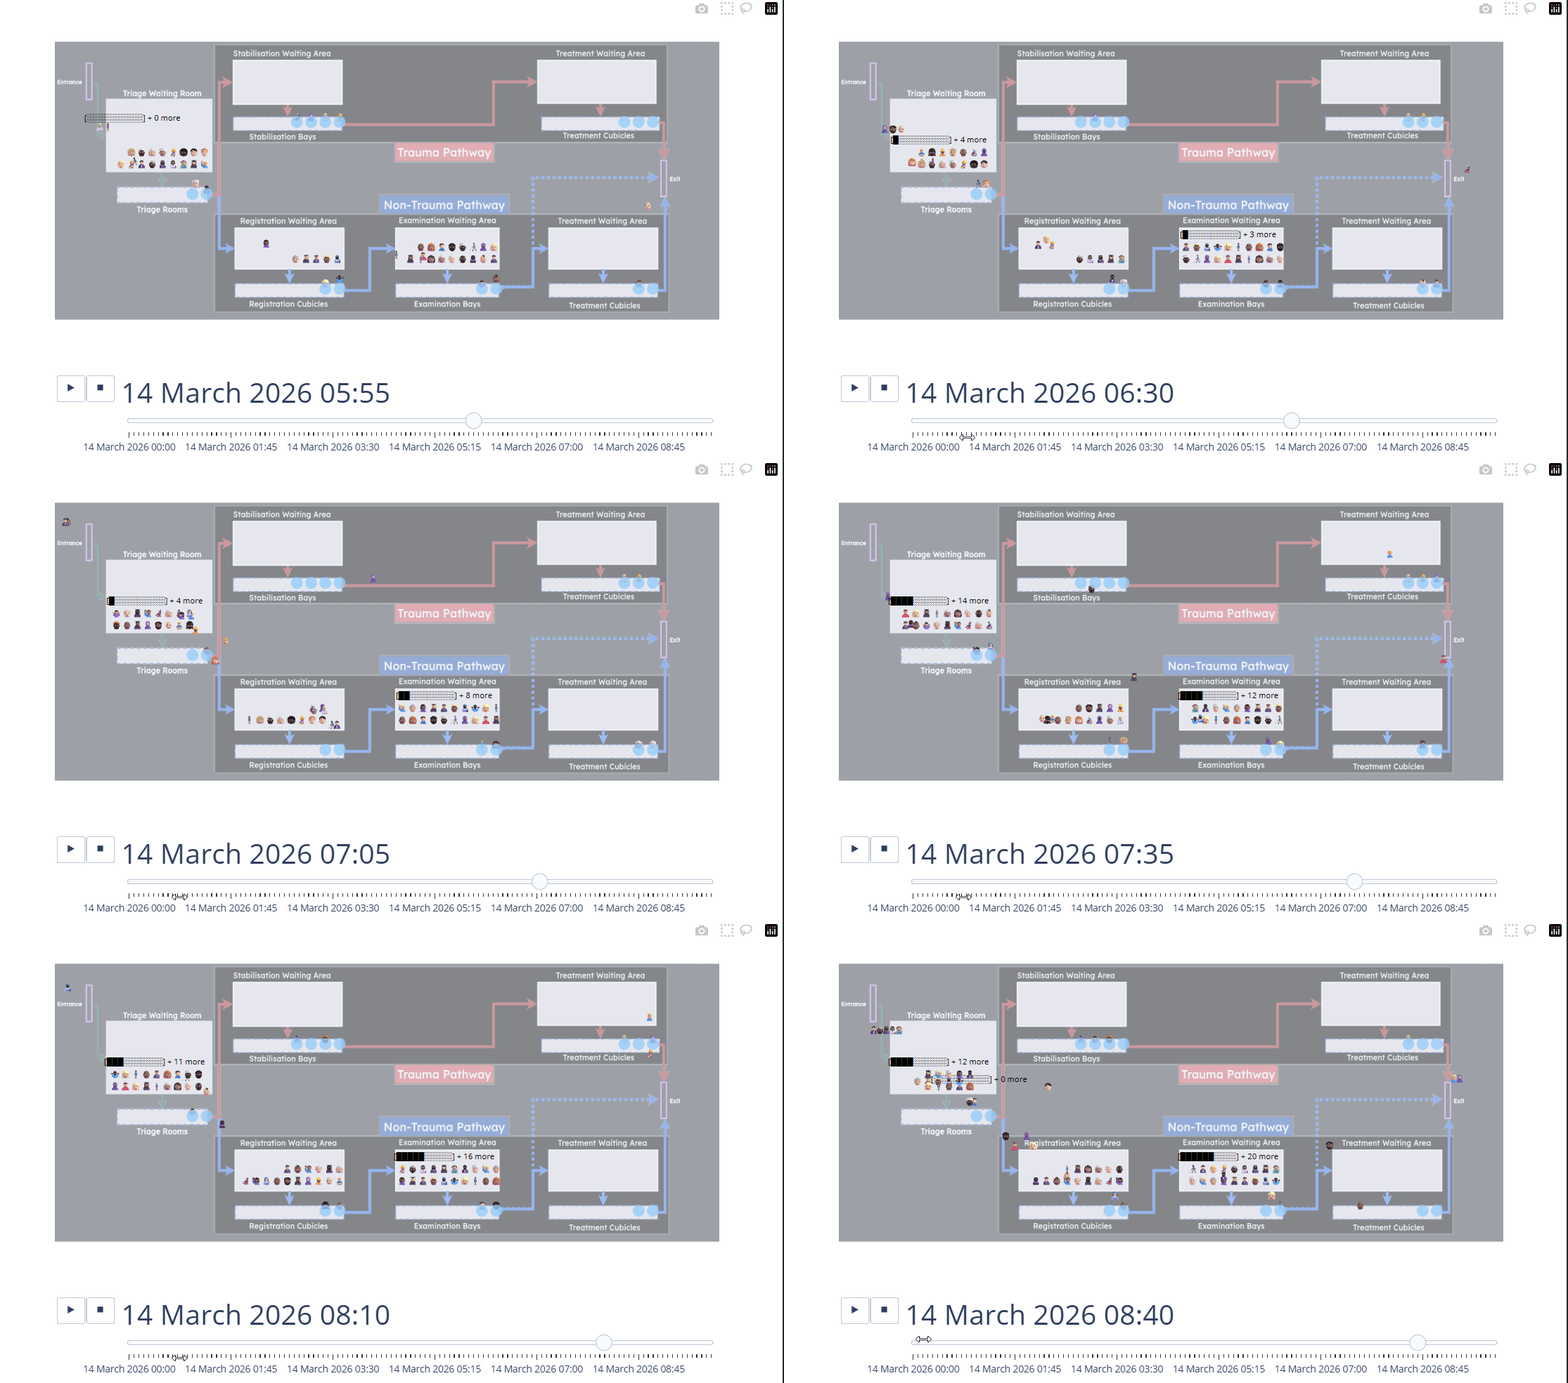
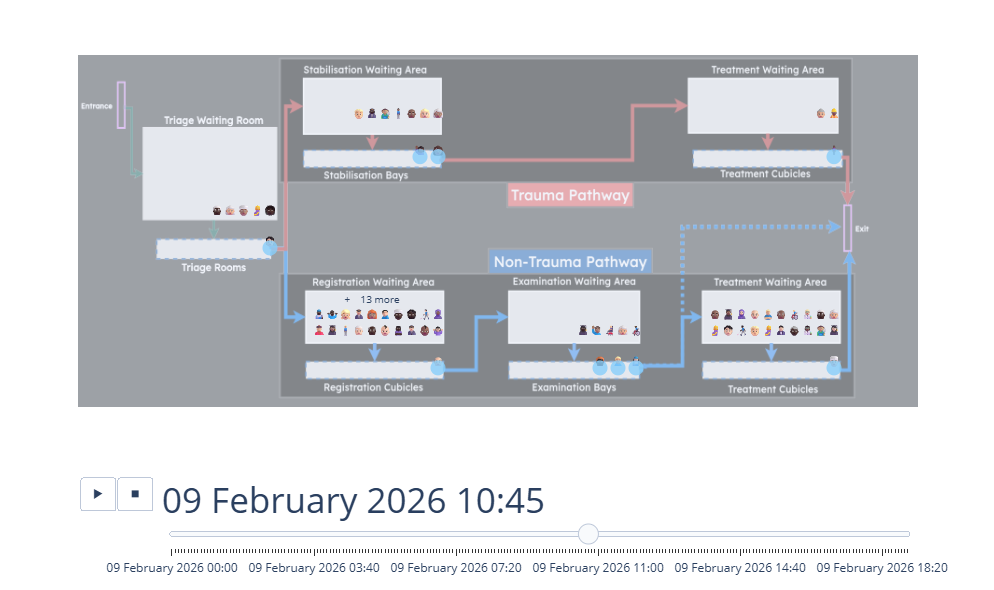
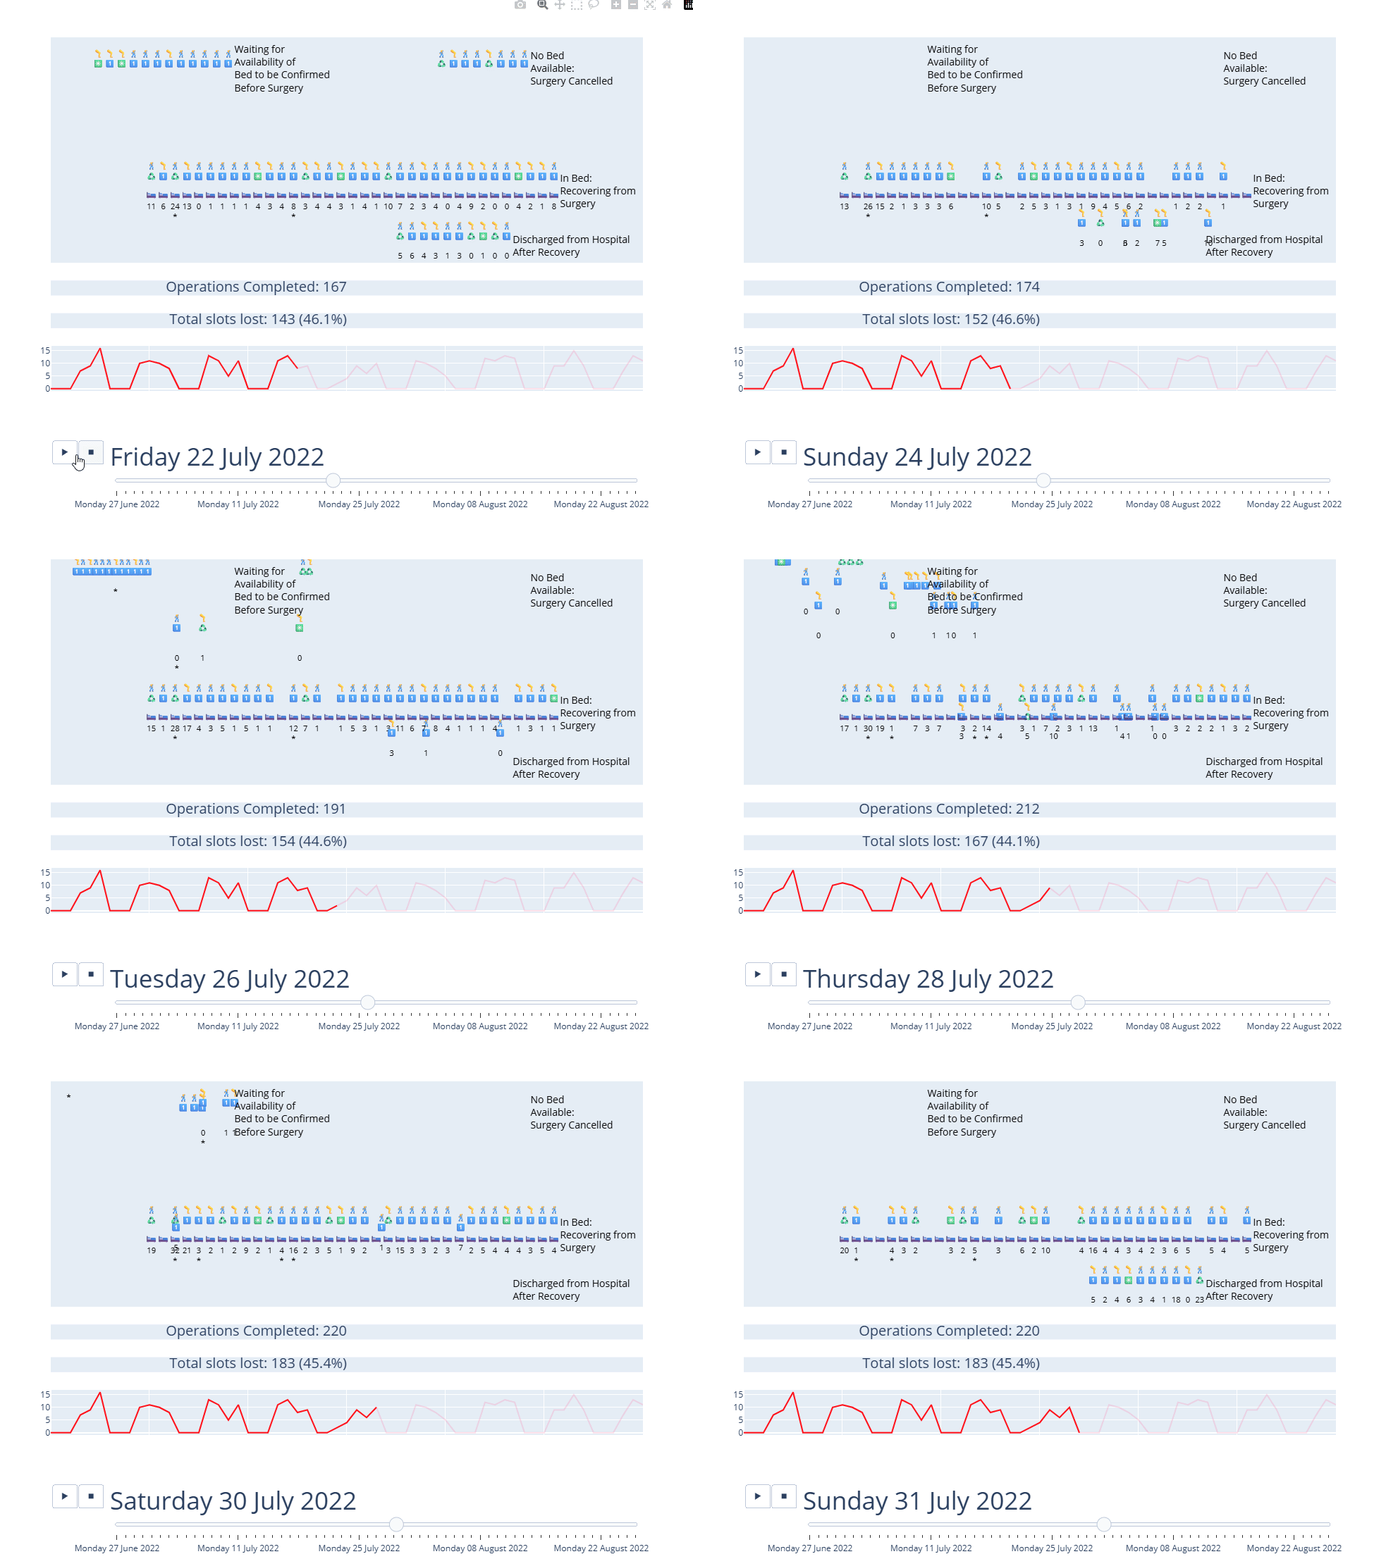
Animations can be enhanced with additional information about individual entities and the whole system.

Advanced Animations - Ward Example

For a ward, this might look like length of stay, or running counts of completed and cancelled appointments.

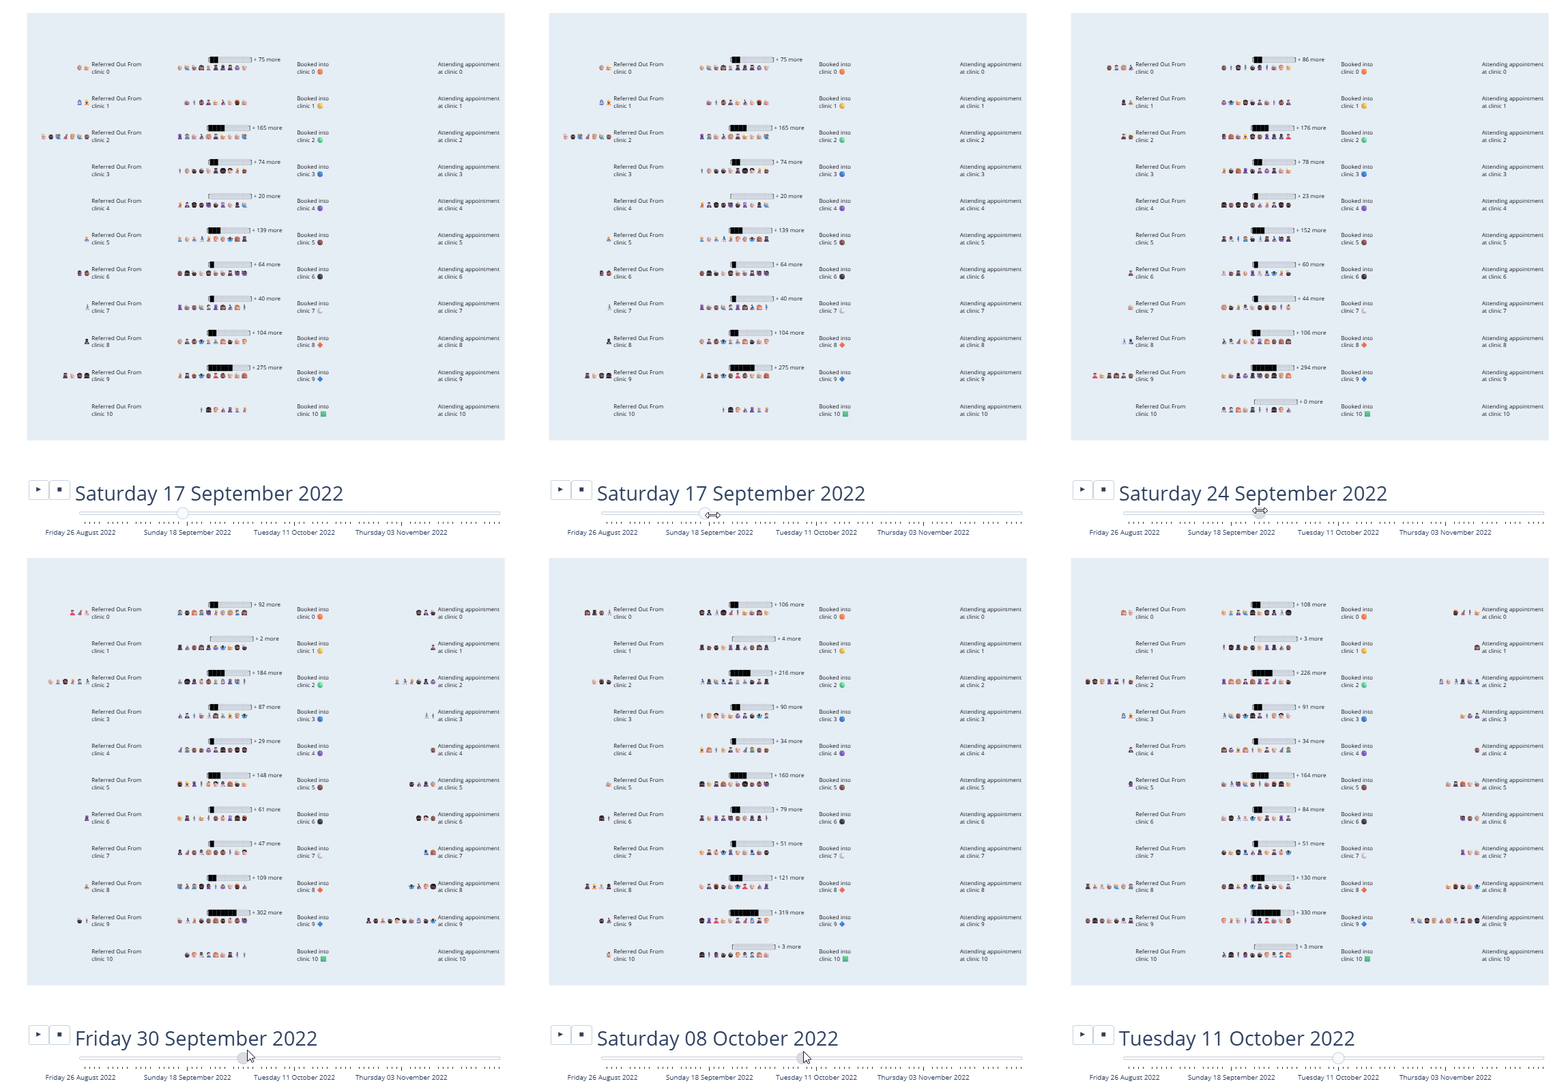
Advanced Animations - Longer Timescales or Larger Systems

And there are ways we can use vidigi with larger systems that run over weeks or months and involve hundreds or even thousands of patients.

Plots - Queues

Vidigi’s EventLogger and TrialLogger come with a wide range of built in plots, helping us to understand how our model is working and communicate this.

base_case_trial.trial_logger.plot_queue_size(
    event_list=["start_queue_receptionist", "start_queue_nurse"],
    limit_duration=base_case_params.sim_duration
    )
what_if_trial.trial_logger.plot_queue_size(
    event_list=["start_queue_receptionist", "start_queue_nurse"],
    limit_duration=base_case_params.sim_duration
    )

Plots - Resource Utilisation

base_case_trial.trial_logger.compare_resource_utilisation(
    scenario=base_case_params,
    resource_map={
        'begin_receptionist_checkin': 'num_receptionists',
        'begin_nurse_consult': 'num_nurses'
        })
what_if_trial.trial_logger.compare_resource_utilisation(
    scenario=what_if_params,
    resource_map={
        'begin_receptionist_checkin': 'num_receptionists',
        'begin_nurse_consult': 'num_nurses'
        })

Process Maps

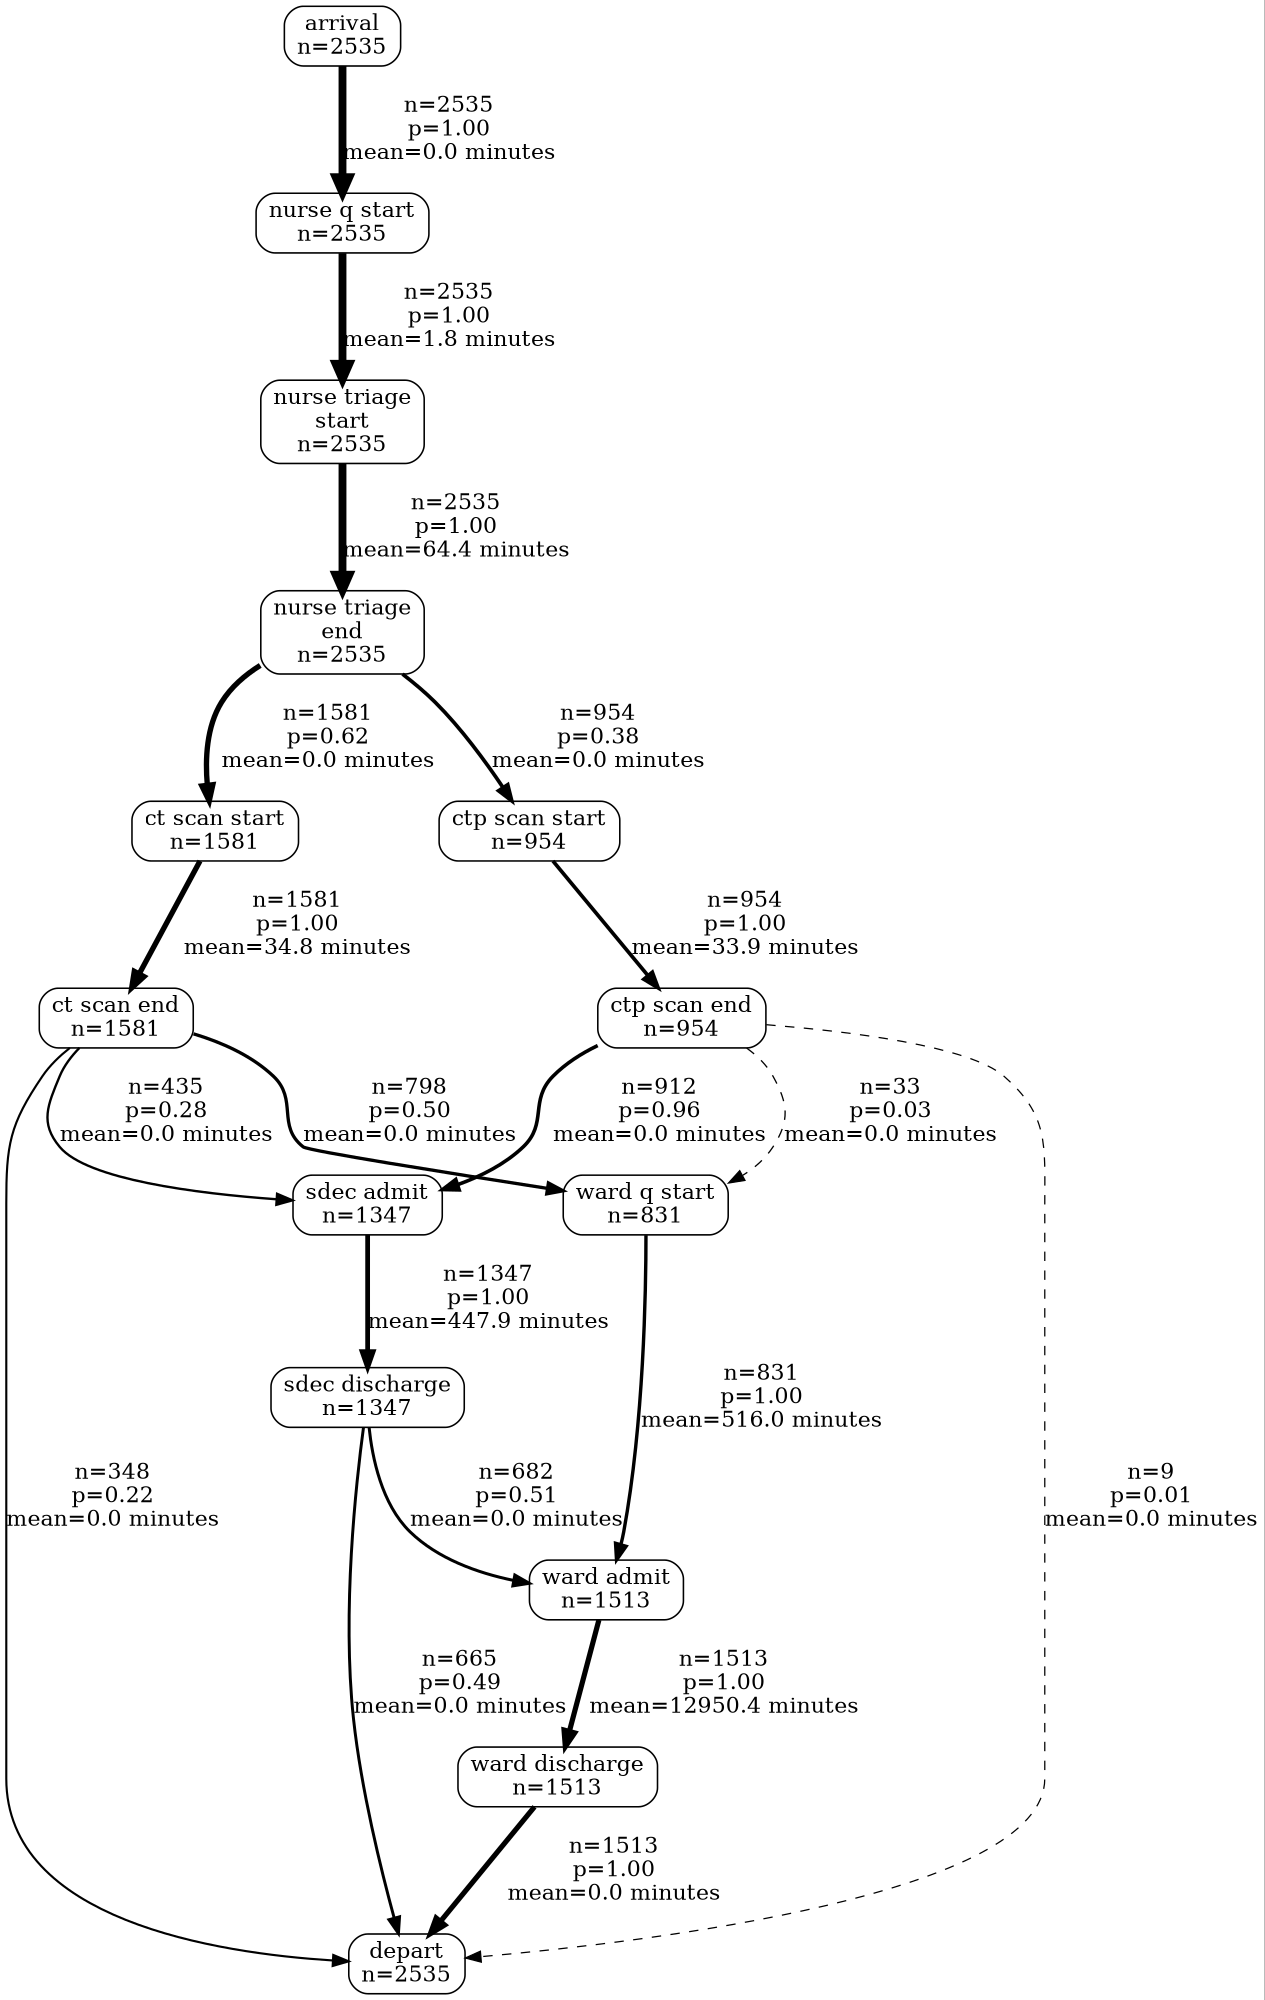
Vidigi also provides process map-style outputs. These may be familiar if you’ve played around with the BupaR package.

While these aren’t animated, they can provide a valuable way to check your model is working correctly, particularly for different subsets of patients with different pathways.

We can see an example below - this type of graph is called a Directly Follows Graph (DFG)

base_case_trial.trial_logger.generate_dfg(run_number=1)

what_if_trial.trial_logger.generate_dfg(run_number=1)

Process Maps

These become even more valuable as your systems become more complex.

Exercise: an animation is worth 10 thousand words

You will be working through a series of exercises in a custom web app.

  • Work through exercises 1 to 4
  • Each exercise may have multiple parts
  • Feel free to experiment! While there are some questions and suggested things to try out, it’s mostly a chance to get a bit more comfortable with vidigi’s code and what you can do with it, as well as getting more practice with interpreting simulations

Note that some of the parameters have changed compared to the notebook you worked on earlier…
35 minutes

This app uses in-browser Python, so you will not have to install anything manually and it doesn’t install anything on your machine.

If you have any trouble accessing it, please shout!