Anybody Have a Map?

Sammi Rosser, Dr Dan Chalk

Health Service Modelling Associates Programme

Welcome!

Boot Disk

Before we introduce ourselves, let’s take a bit of time to hear from you:

  • Name
  • Role
  • Organisation

A few quick questions…

Who do I work for?


  • National partnerships between academia and NHS
  • Undertake collaborative, applied research
  • We sit across the Universities of Exeter, Plymouth and Bristol

We are measured on the impact we generate

Who am I?

  • Ex NHS data scientist
  • MSc health data science, 2021
  • Postdoctoral research fellow for 3 years
  • Author of software for simulation visualisation and geographic optimization
  • Trainer on the core HSMA programme

What is HSMA?

The Health Service Modelling Associates (HSMA) Programme aims to grow advanced data science and modelling capacity in healthcare services.

1 day a week for 15 months


6 MONTHS

Extensive training course teaching programming, Operational Research (OR) and Data Science Methods


9 MONTHS

Apply skills to a project of importance for their organisation with mentoring and guidance from us

There is such a thing as a free lunch?

The full programme is offered free of charge

Teaches entirely Free and Open Source approaches

So no ongoing software licencing costs!

HSMA Impact

Over the last 10 years…

we have taught over 450 students…

from over 100 organisations nationally

HSMA Impact Stories

Supporting multi million £ business cases

An early HSMA project was instrumental in obtaining capital funding for for a new facility, reducing patients in crisis being sent out of area at significant cost and away from support networks

Improving Performance

What-if analysis allowed a HSMA team to work out how to redesign pathways to improve urgent care flow, improving patient and staff experience

Ensuring patient safety

A GP used simulation modelling to identify issues with COVID vaccine rollout plans in their area - the week after learning it on the programme

Driving better outcomes while saving money

A recent HSMA project identified £500k+ cost saving opportunities in stroke care while reducing disability and helping patients be discharged faster

Helping Shorten Waits

A previous project helped to identify strategies to reduce rheumatology patient waiting times by 10 weeks within 5 years

Wider HSMA Impact


In-house capacity building

New data teams developed with HSMAs can manage complex projects that were previously only achievable with consultancy support


Preparing Staff for their Next Steps

HSMAs are given the skills and confidence to pursue further education, with some alumni taking on MSc degrees in health data science to continue honing their skills


Lifelong Access to a Community

HSMAs gain lifelong access to an alumni community of over 450 people who’ve been through the programme

HSMA Approach to Teaching

We’re teaching you complex, valuable stuff in a (hopefully) fun and lighthearted way

  • We spend far too much of our lives being very serious
  • I could give you a very dry lecture for three hours
  • But you’ll actually learn and remember more this way
  • We respect your time in coming here today; we’re here to deliver serious learning, sometimes unseriously

HSMA Lambda

What is HSMA Lambda?

A series of standalone workshops targeted at decision makers in the health service

Each workshop focuses on a different modelling or data science approach


Simulation for Pathway Problems

How can simulation modelling help improve patient flow and reduce waits?


Mapping and Modelling for Location Problems (today!)

How can we use maps and optimization to make data-driven, fairer decisions about services?


Machine Learning for Operational Enhancements

How can we use machine learning for improving the efficiency of our services?

Today’s Goals

What questions can these methods be used to answer?

How do the methods work (at a high level)?

How do I interact with and interpret these models?

What problems in my own organisation can be answered with these?

What can we tackle together?

Who can I send from my organisation to learn the skills to answer this question?

By the end of today, you’ll leave today with structured questions to form the basis of future HSMA projects

The Lambda pathway

The HSMA pathway

An Intro to Operational Research and Data Science

Before we talk too much about the impressive things we can do, you need to understand some core concepts.

Operational Research

Data Science

Applying modelling, simulation and analysis techniques to help inform decisions and improve decision making.

Using methods from machine learning, statistics, data mining and data analysis to generate insights from data.

We start with a system and/or process

We start with the data

We use data to parameterise a model to emulate the system/process in-silico.

We use techniques to explore hidden patterns and structures in the data to gain new insights.

OR vs DS Fight

“We have lots of data on readmissions.

Can we teach a machine to automatically identify which patients are likely to be readmitted?”

“We want to make these changes to our process for triaging patients.

What do we predict the impact will be?

What resources will we need to ensure the process is efficient?”

Hat Dan is talking about data science

Fonz Dan is talking about operational research

The benefits of modelling

Emulation

A model is a version of reality that can be altered without risk or consequence.

Communication

A model can help people communicate about a problem using a shared language and point of reference.

Speed

Typically, models can be designed and built much more quickly than real world changes can be put into place.

Systems Thinking

The process of designing the model can help people to think about their systems.

Objectivity

A model can provide objective support for an argument.

Assuming it’s been built objectively, of course…

“What if?” analysis

Modelling allows us to undertake something known as “what if?” analysis.

Base Case

This represents our system as it is.

This allows us to see what’s happening now, validate the model and help identify what we might want to think about changing.

“What If” Analysis?

This allows us to test scenarios in the model, deviating from our base case to see what the impact might be if we changed x, y or z.

What if I changed the opening times?

What if I moved resource from this part of the pathway to another?

What if demand increased by 10%?

What if we opened a new site here?

OR, DS and Analytics

In our experience, the NHS typically spends about 90% of its analytical capability on looking at right now or backwards

What’s the status of this service today?

How did we do last week/month?

The Analytics Pyramid

What HSMA Builds To

The full picture

Discussion

Where do you feel like your organisation is in this progression?

  • Do you know if you have someone with the job title ‘data scientist’ or something similar?
  • Do the splits between backward and forward reflect your experience?

A Note Before we Proceed

In our other lambda workshop, we teach Discrete Event Simulation (DES)

This is a powerful technique for building models of queues and pathways - like elective waiting list, hospital theatres, emergency departments, and more.

A Mental Model for DES

Discrete Event Simulation is like Lego

We give you a few bricks - the core components of discrete event simulation - and suddenly you can build pretty much anything you can imagine

A Mental Model for Geographic

Geographic modelling is more like getting into DIY and buying yourself an empty toolbox.

You start with your core geographic knowledge and map building skills.

This is your hammer.

DES vs Geographic

And it will take time to build up your collection of tools…

But HSMA gets people started with some really powerful techniques that can help with data-driven decision making.

While we can’t teach students to solve every geographic problem, we help them

  • Fill their toolkit with the core tools they’ll need again and again
    • geographic concepts, map making, travel time matrix generation, automated reporting, web apps
  • Add in some fancy tools for certain kinds of problems (location optimization)
  • Understand where to go to get a new tool when they need it
    • Or use their other tools to build a super-tool!

Key Geographic Concepts

Before we talk too much about the impressive things we can do with geographic data science, we need to cover some fundamentals.

The power of maps

In recent years, we’ve experienced the power of the digital mapping revolution.
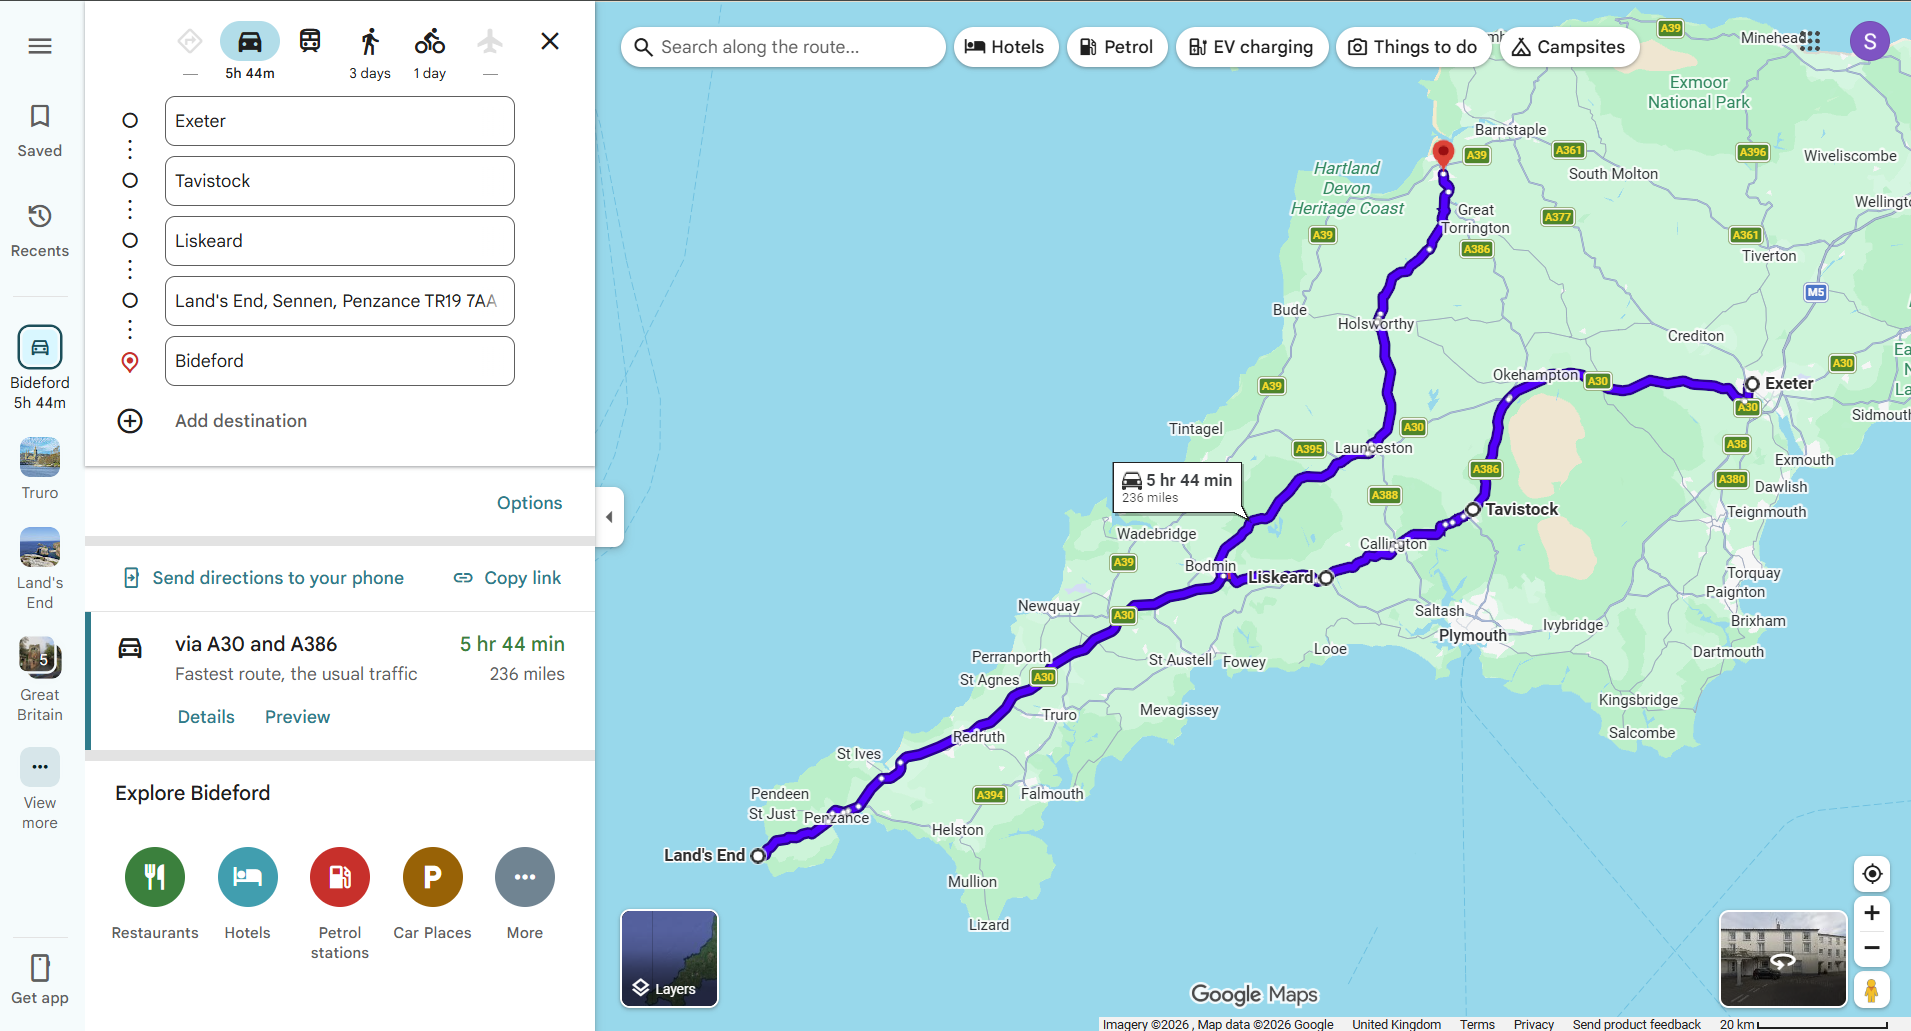
It’s now entirely normal to us that we can generate routes in seconds, with accurate travel times, traffic data, points of interest…

Placeholder

But are we reaping the benefits of this digital mapping revolution in NHS analytics and service planning yet?

The past…

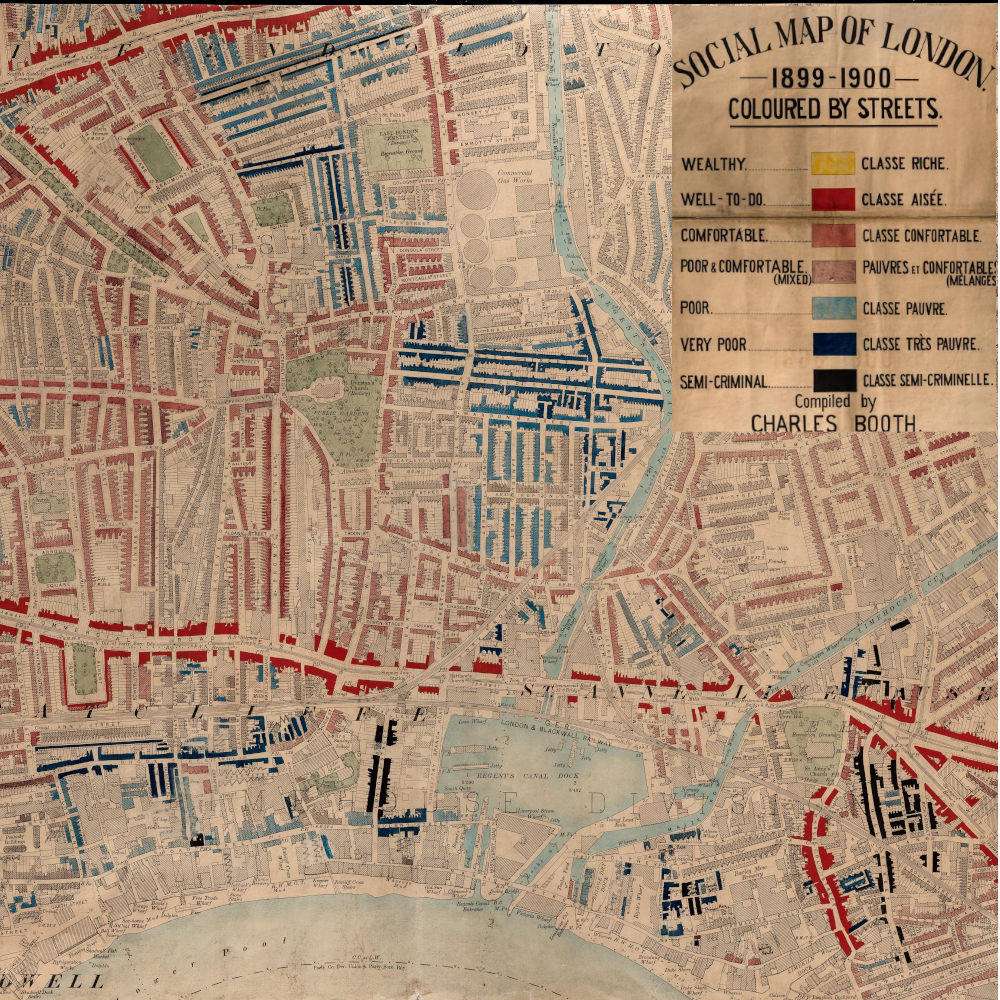
This was revolutionary!

Maps

The digital age makes it possible to use and obtain rich geographic data, and make maps

(More) quickly

Routinely / in automated reports

Interactively (where appropriate)

Kinds of Maps and Geographic data

But you might not have thought much about the different kind of maps that exist since you last did a geography lesson at school!

Knowing what’s possible helps you to request the right analyses and critically analyse what is produced.

This forms a crucial lens for evaluating more advanced location work.

Point Maps

Point maps tell us where useful things are, like existing resources (hospitals, GP surgeries).

Point Maps - Enhancements

And we can do quite a lot with them to make them more useful!

Choropleths

Choropleths allow us to understand statistics about areas.

Choropleths + Points

And one of the most powerful things we can do is combine the two!

Just from this map — where would you put a new centre? Answer anonymously in the poll.

Tobler’s First Law

But to interpret things about areas correctly, we need to consider this key geographic principle from the one of the most influential geographer’s of the 20th century, Waldo Tobler.

Everything is related to everything else, but near things are more related than distant things

Tobler’s First Law in Action

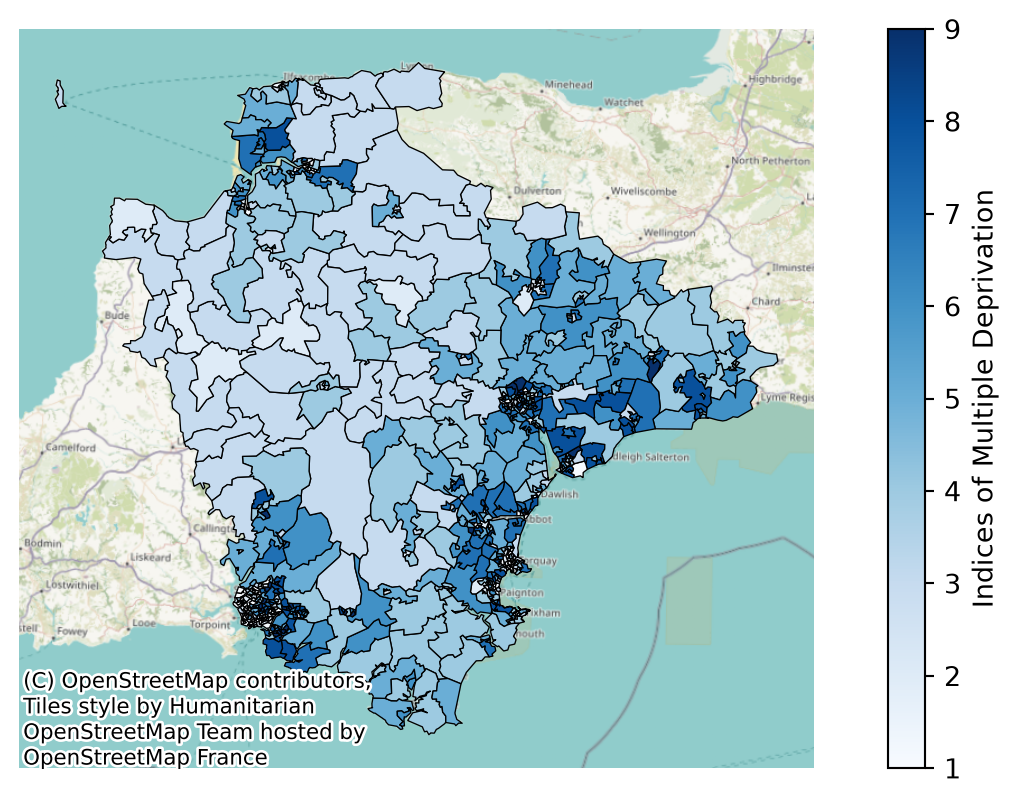
What does this mean in practice? Two maps of the same nine deprivation deciles across Devon — one is the real pattern, one is the same values shuffled randomly across the same areas.

Which is real — left or right? Vote in the poll.
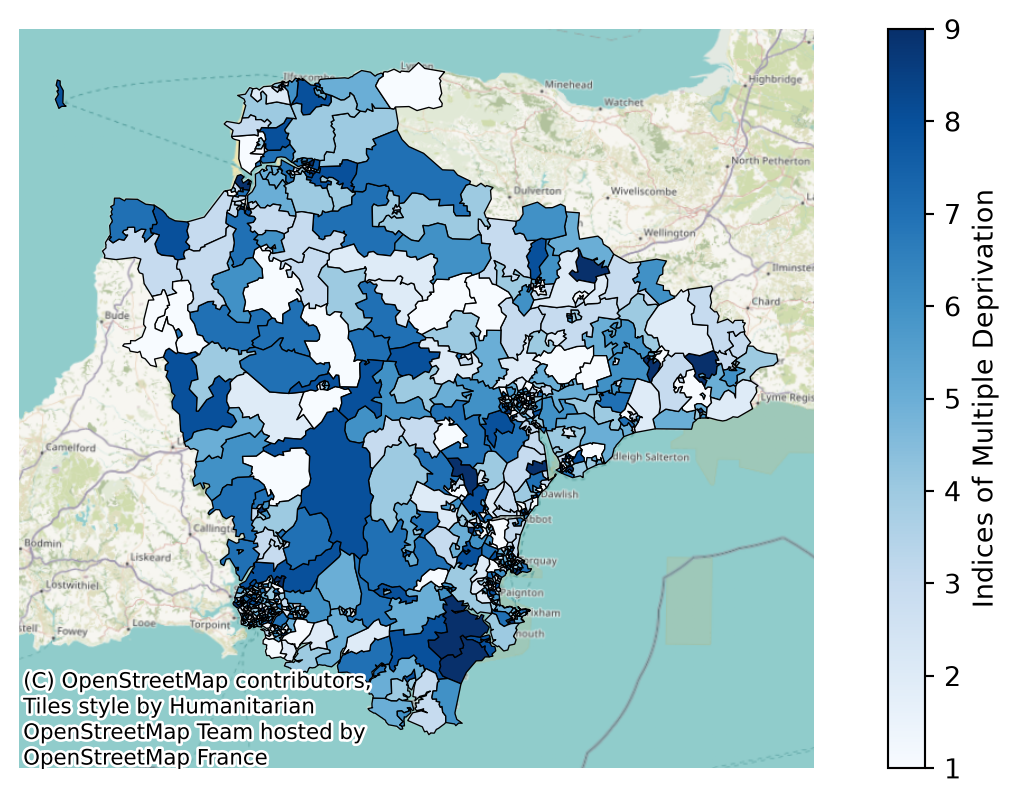
Indices of Deprivation - randomly spread

Indices of Deprivation - real spread

Hotspots
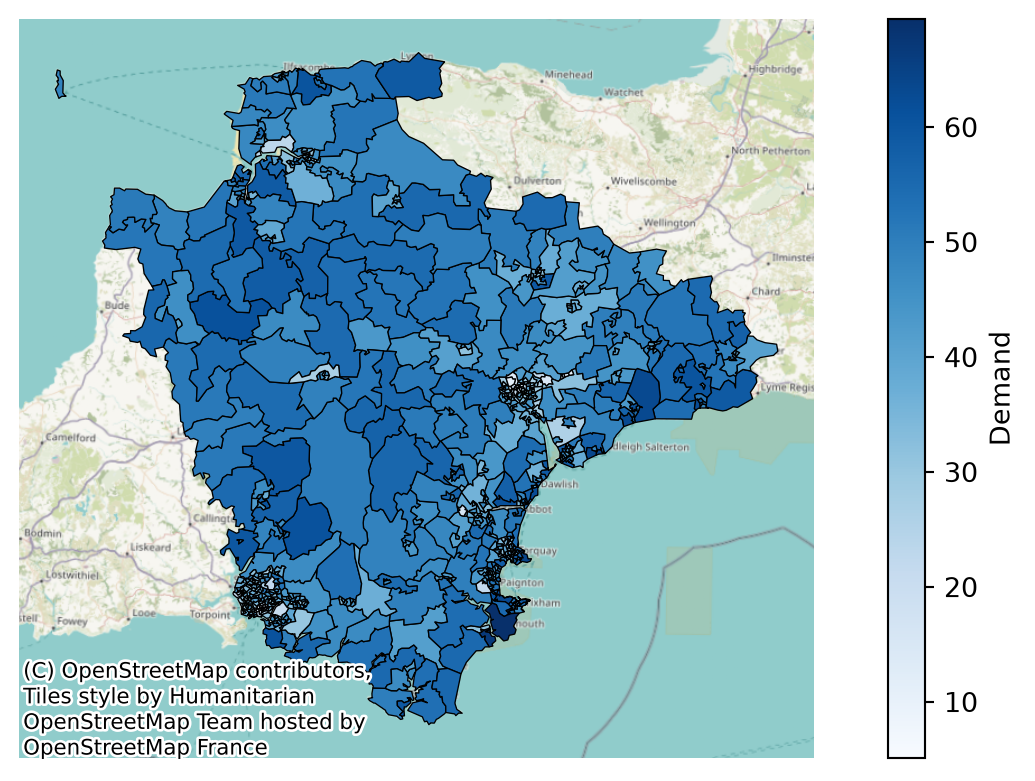
Choropleths can tell us how a metric (like demand, equity, or incidents) varies.
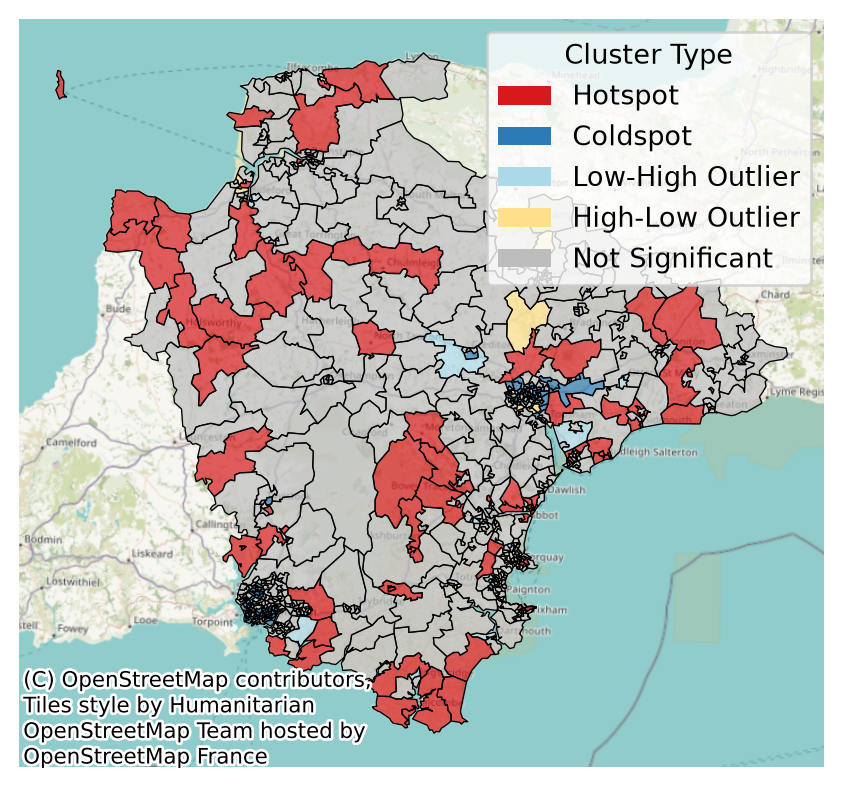
But using statistical methods for identifying hotspots, coldspots and outliers can help us identify significant patterns.

Data

National Free Datasets

  • Geographical boundaries at different resolutions
  • Road networks
  • Bus and tram timetables (and, to a lesser extent, rail)
  • Indices of Multiple Deprivation (aggregated and domains)
  • Population by age group
  • Certain types of healthcare asset (GP surgeries, dentists, care homes, adult social care, etc.)
  • Environmental Data
  • Ethnicity
  • Car availability estimates
  • Healthcare indicators (diabetes prevalence, etc.)

Locally Held Datasets

  • Your demand
  • Your activity
  • Your services
  • Service capacity

Generated Data

  • Travel times to current and proposed services
  • Carbon impact of travel
  • Projected demand


Travel Times

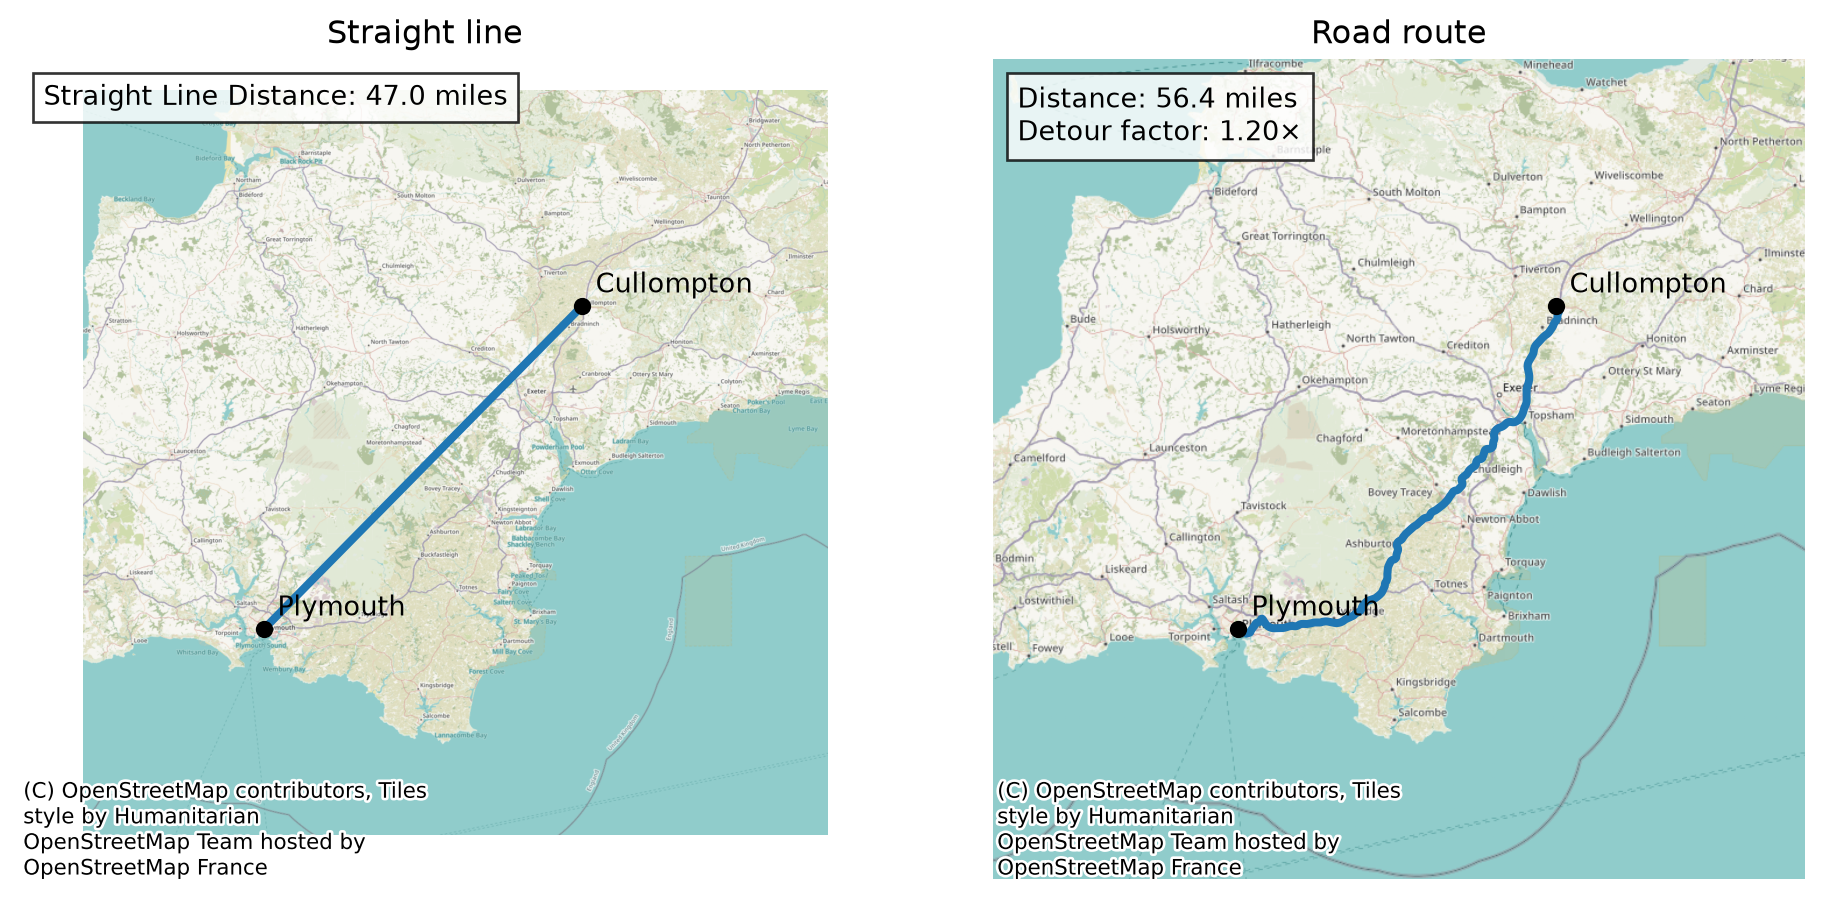
Most of our more complex uses of geographic data require some sort of travel data.

But what level of detail do we need?

Travel Times - Good Enough?

Travel Times - Limitations
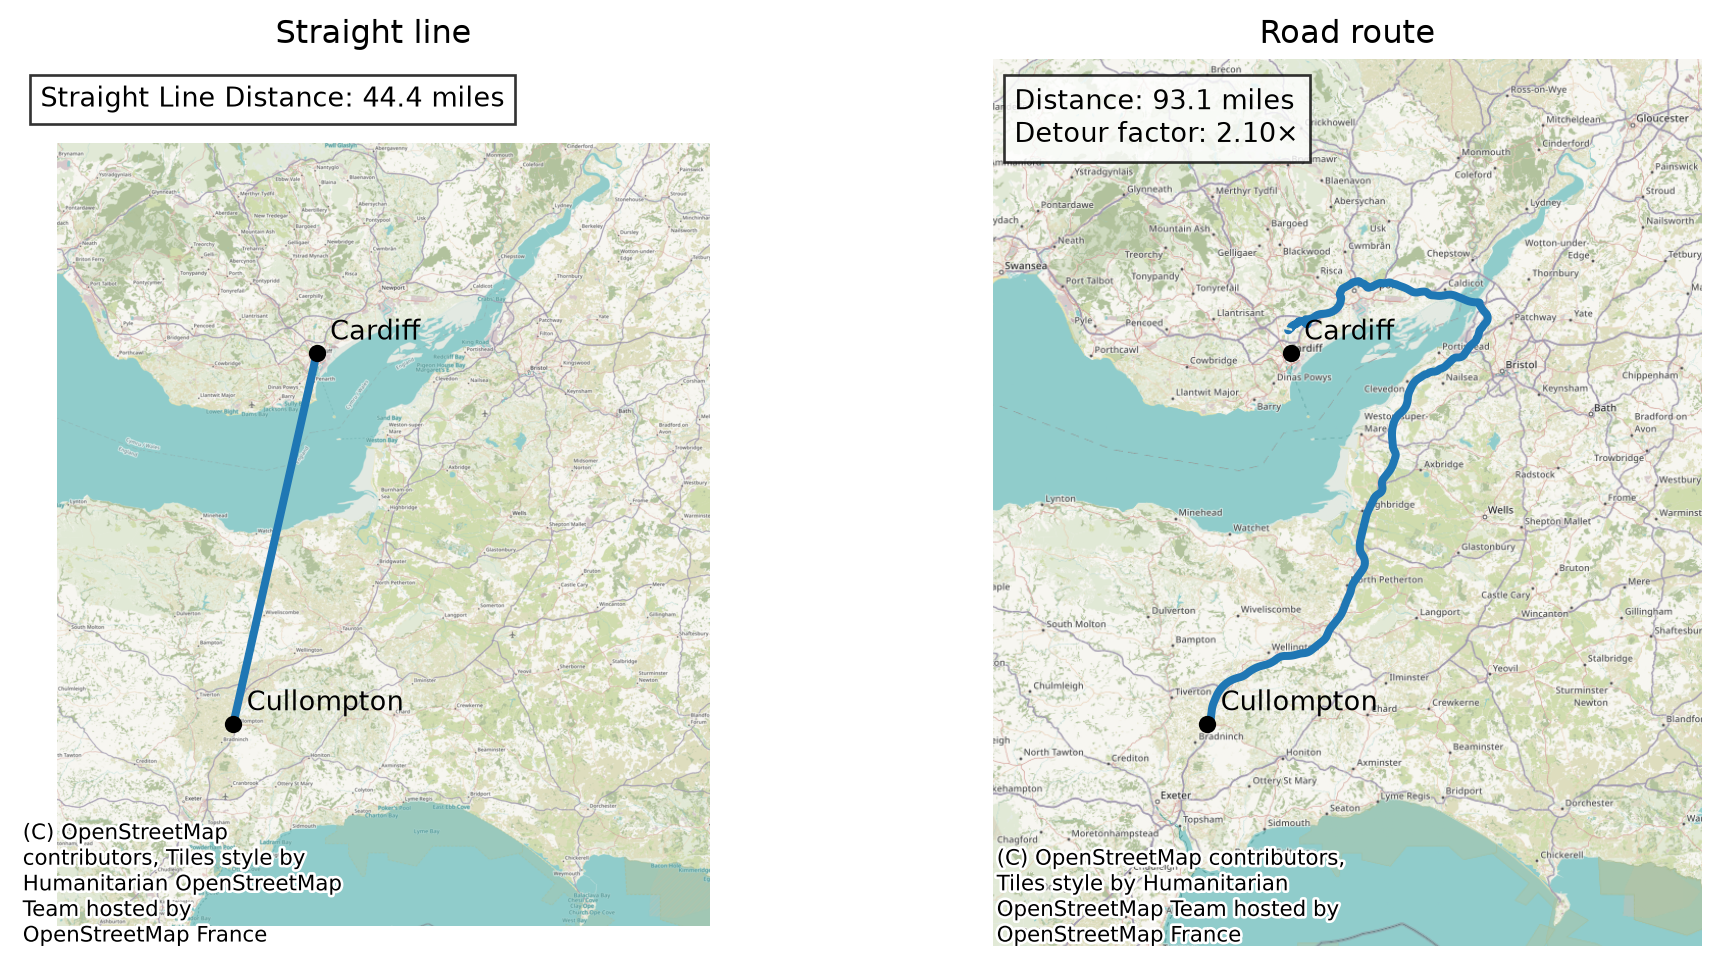
Obtaining Travel Data

There are two key main ways we can get this data:

Web-based
  • Free - but only up to a point
  • Can give access to more advanced data (e.g. traffic-aware times)
Local
  • Totally free, regardless of volume
  • May be slightly less accurate - but often sufficient
  • Often challenges with getting this installed on locked-down NHS laptops

You may need to help HSMAs get access to one or the other!

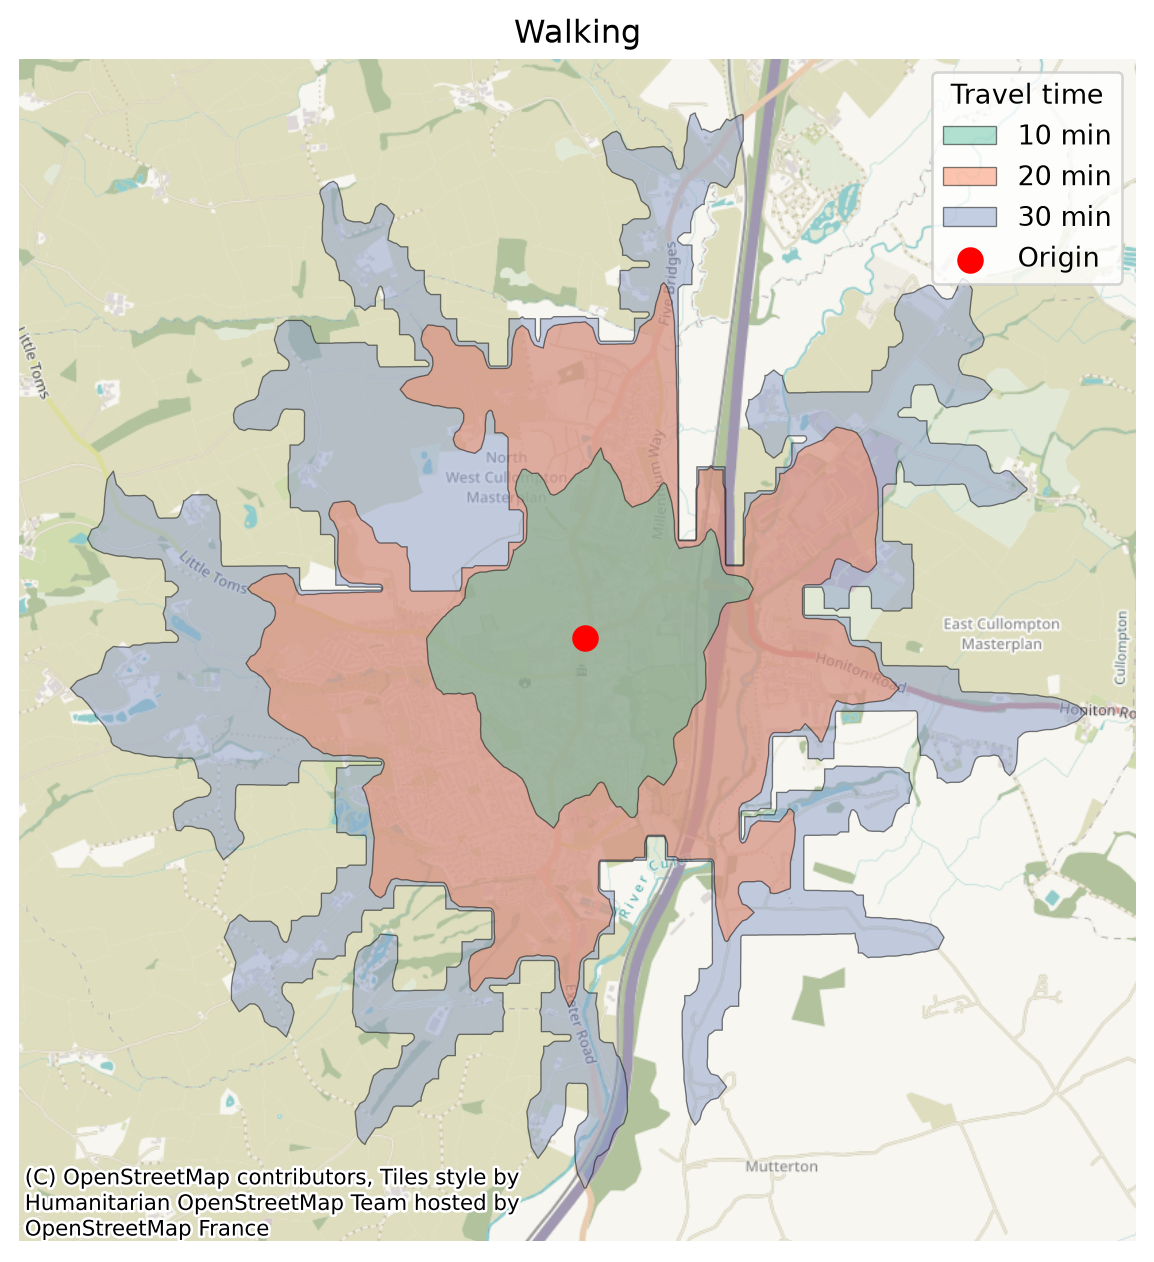
Isochrones

Travel times open up more plot types
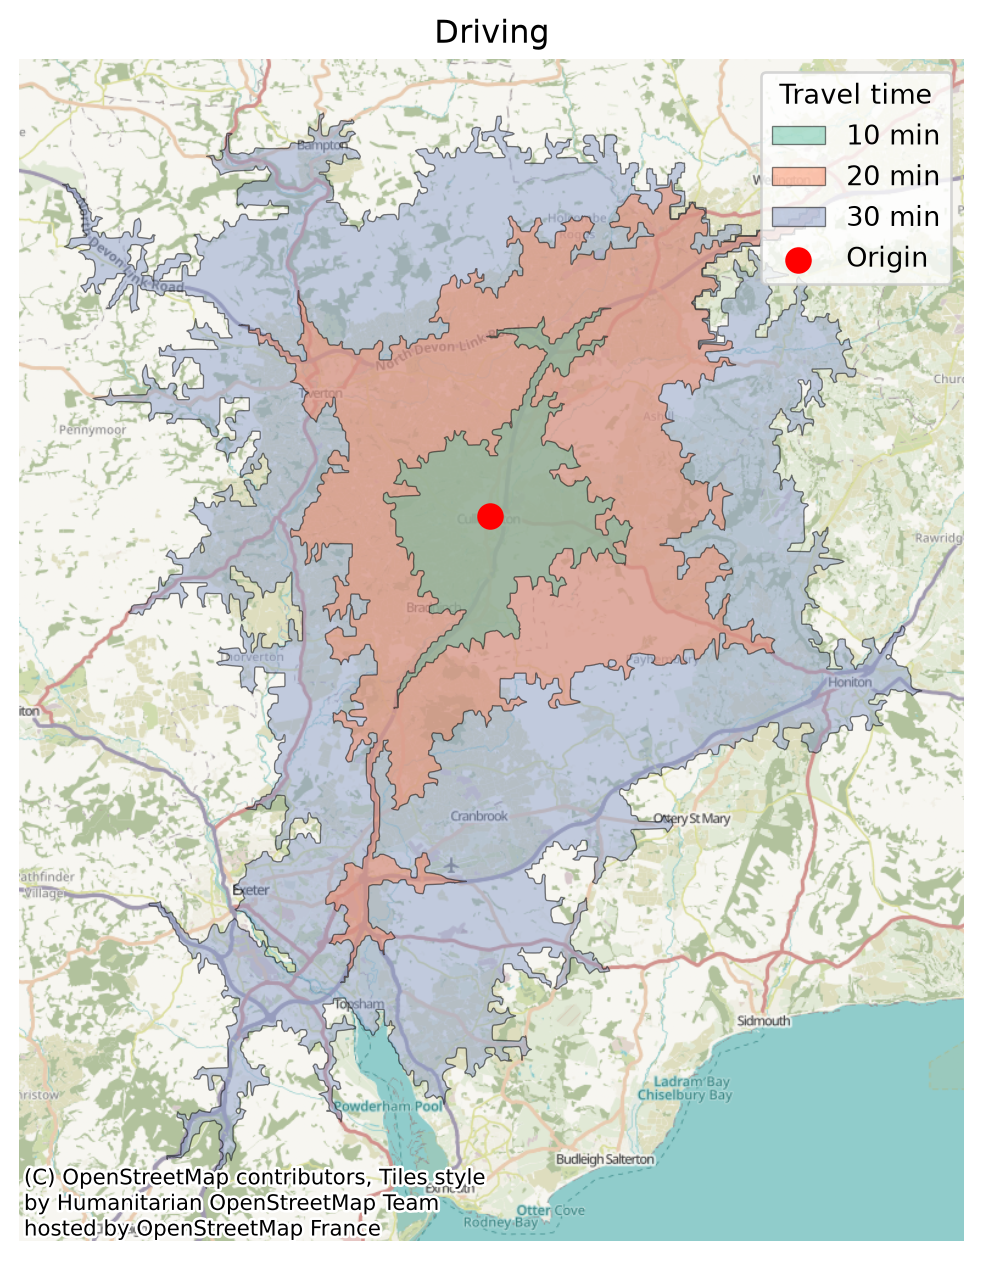
Coverage
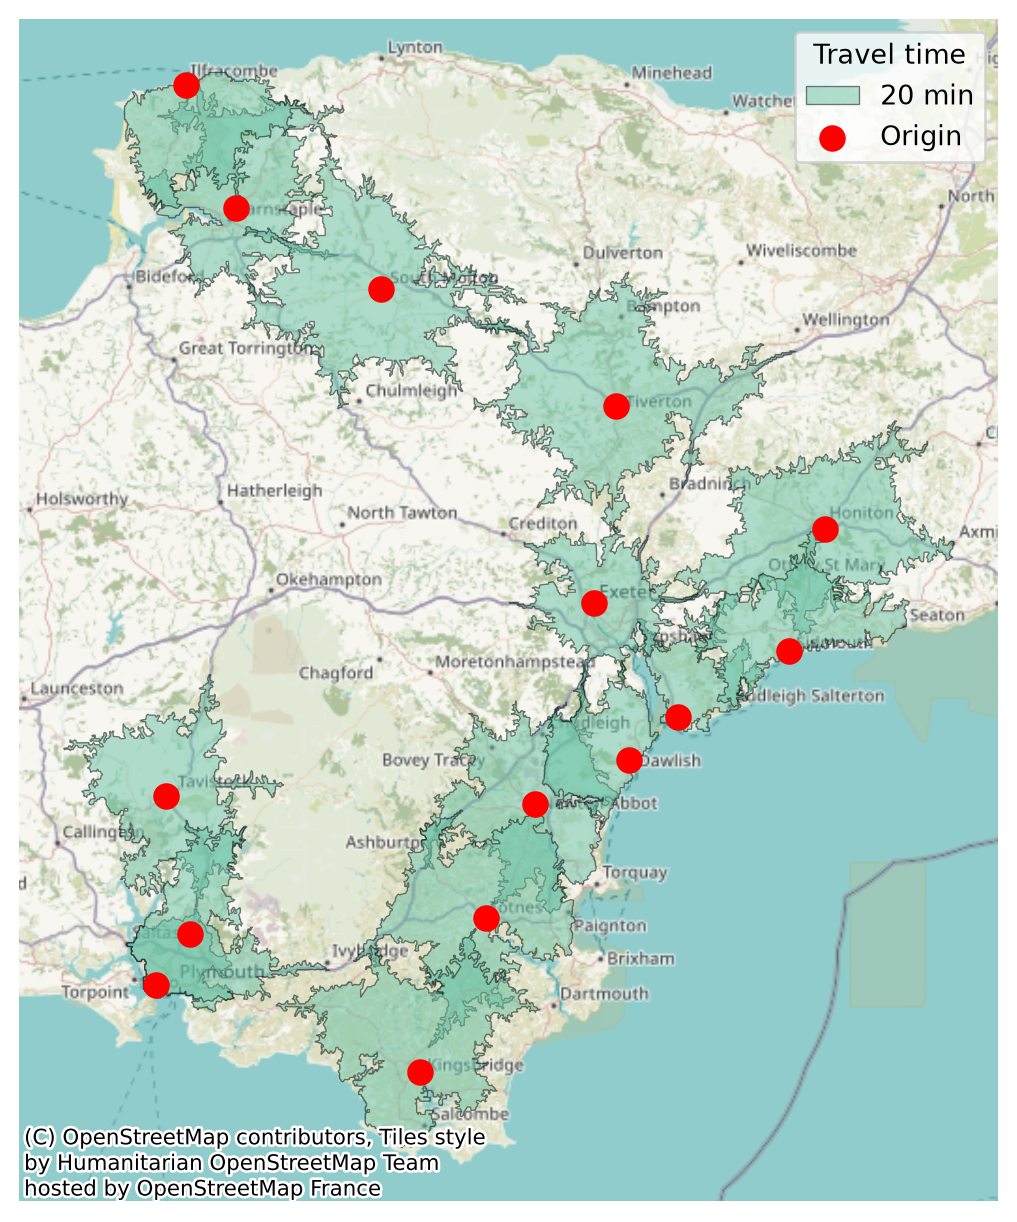
Layering multiple isochrones is one way we can start to get an idea of where there are areas of poorer access that could be targeted.

Catchment

Taking this one step further, 2SFCA (2 step floating-catchment area) combines both demand and capacity to give a more detailed look at not just where there is access (which we define as a particular travel time banding), but where there is sufficient capacity.

Being close to a clinic doesn’t guarantee you can get seen there — if lots of other people can also reach it, it’s effectively less available to you.
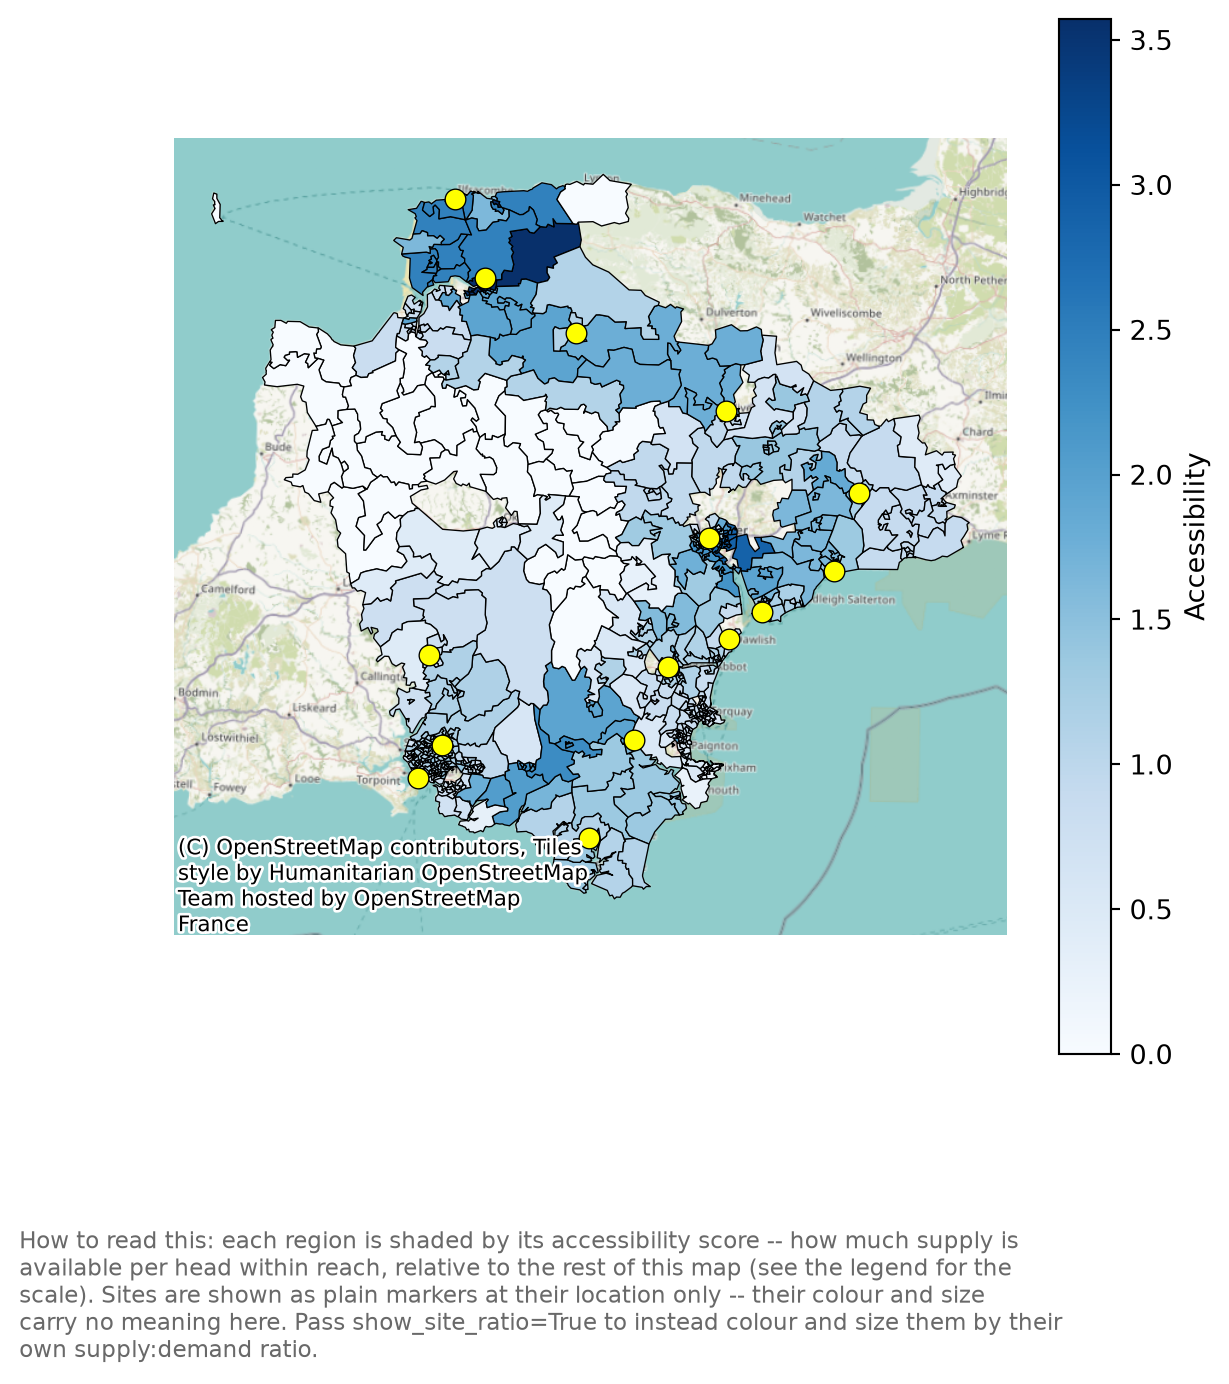
Catchment

Step 1: How stretched is each facility?

Compare what a facility can offer (e.g. 8,000 appointments a year) against how many people could realistically reach it.

This gives a “supply per person” score for that facility — low score = oversubscribed, high score = spare capacity.

Step 2: How much real access does each area have?

For each area, add up the “supply per person” scores of every facility it’s within reach of.

Areas near several well-resourced facilities score well; areas that only reach one crowded facility score poorly — even if the raw travel time looks fine.

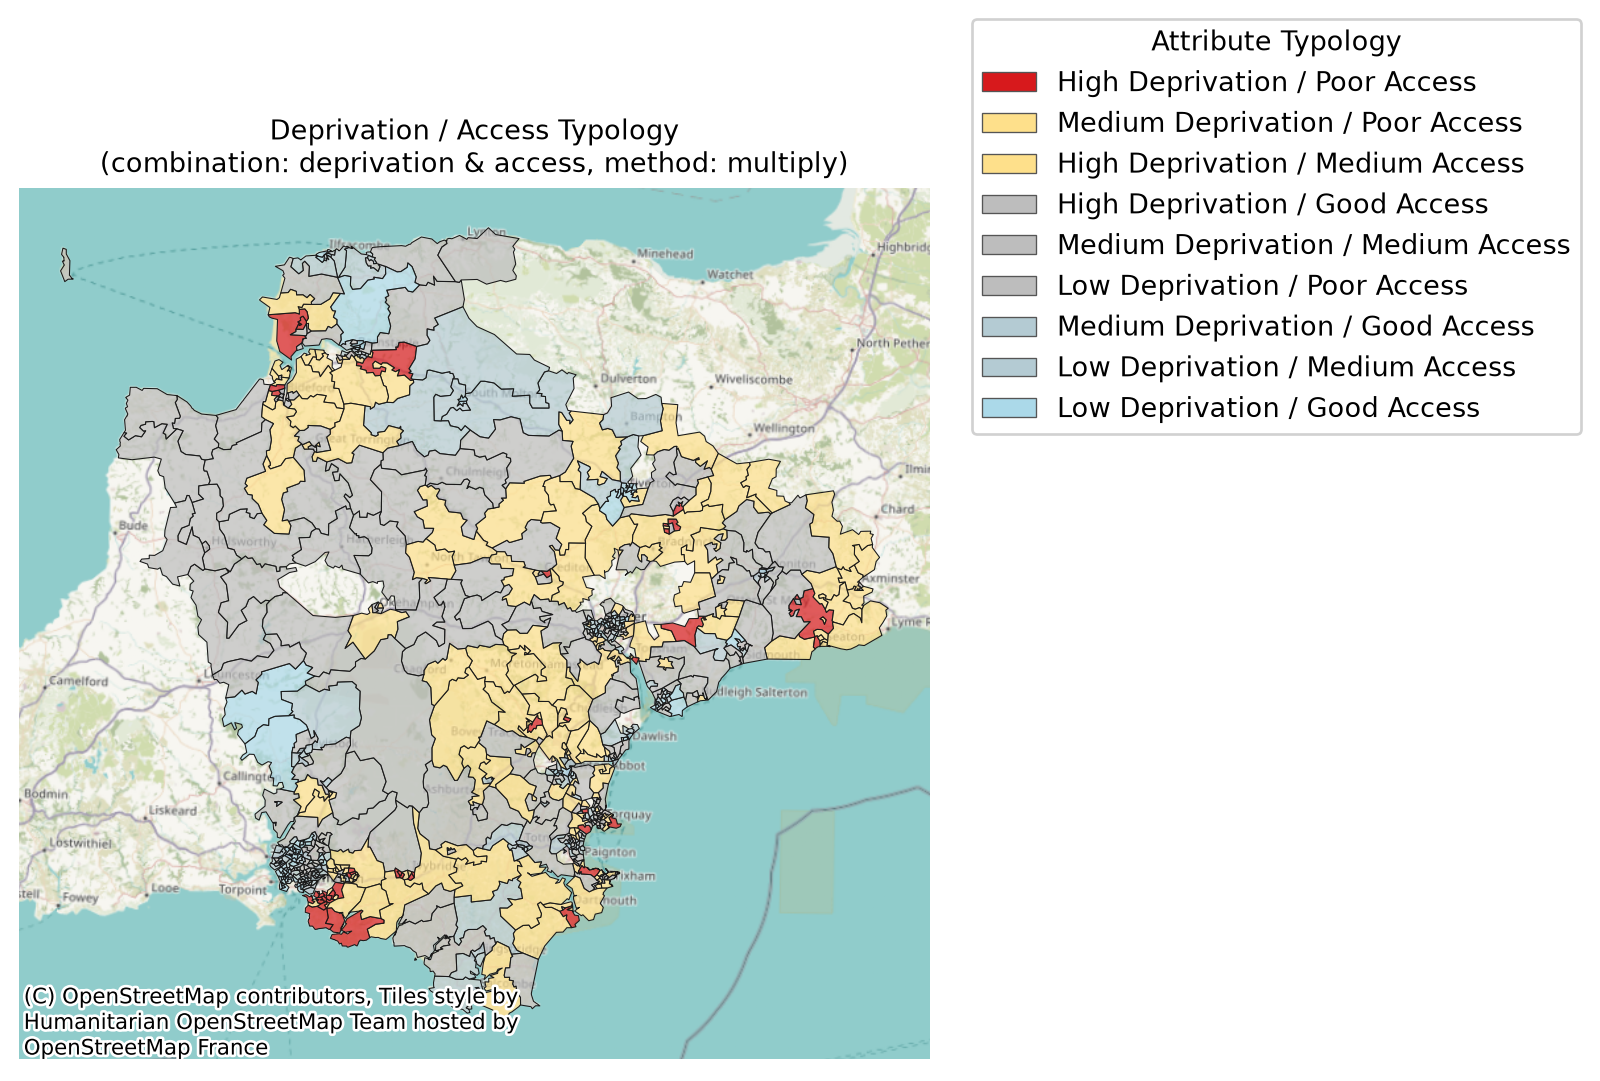
And more kinds of hotspots!

We can combine travel data to identify high priority areas, like high deprivation and long journey times.
Quick Discussion

Two minutes — answer the poll. No names, no wrong answers.

How does geography already play into decisions in your organisation?

Hold onto that thought — now you’ll divide into groups.

You’ll have 10 minutes to come up with as many examples as you can of problems you think are geographic problems in your organisations.

Enter them into the Menti using your devices.

Your Answers

Location Optimization

Remember this one?

What if we opened a new site here?

Location optimization is how we answer it properly.

It’s the first power tool we hand HSMAs once they’ve got the mapping fundamentals.

Flavours of Location Problem

Many geographic problems come down to one of these three things:

Expansion

“I need to add a site”

Where should our new community diagnostic centre go?

Consolidation

I need to remove a site

Which of our sites do we close when the estate has to shrink?

Network Design

I need to work out where to put a load of sites where none currently ‘exist’

Where do all the vaccination centres go?

Why can’t we just eyeball it?

Fourteen candidate sites, and funding for one. That’s fourteen options — small enough to list on a whiteboard.

Until the question changes.

14

Options to weigh up when opening 1 site.

91

Options to weigh up when opening 2 sites.

364

Options to weigh up when opening 3 sites.

1001

Options to weigh up when opening 4 sites.

2002

Options to weigh up when opening 5 sites.

3003

Options to weigh up when opening 6 sites.

Every site you add to the question multiplies the answers.

And that’s the easy part

Each of those options has to be judged against several different measures at once — and those measures disagree with each other.

At fourteen options, a patient analyst can at least build the table.

Reading it is another matter — fourteen rows, a column for every measure, and no single row that wins on all of them.

And nobody stops at fourteen. The neonatal project we’ll look at later chose from 22 candidate sites — run the same escalation out that far and you’re not weighing up hundreds of combinations. You’re into the thousands.

Location Optimization is the branch of operational research that scores every combination against every measure — and tells you which handful are actually worth arguing about.

Best at what?

Before it can rank anything, the model has to be told what “best” means.

The shortest average journey?

The most people within 30 minutes?

The shortest worst-case journey?

The shortest journeys for the most deprived third?

The narrowest gap between the most and least deprived?

The model doesn’t decide which of these matters. You do.

When Objectives Disagree

Say you’re choosing a car. You care about two things: price, and boot space.

Car A

Cheap. Tiny boot.

Car B

Expensive. Huge boot.

Car C

Expensive. Tiny boot.

Car A and Car B are both defensible — neither beats the other. Each wins on something you might care about.

Car C isn’t. Something else beats it on price and boot space at once. Nobody would choose it — rule it out.

Today’s optimiser does exactly this, across more objectives and many more options. What it hands back isn’t one right answer — it’s a shortlist of defensible ones, like Car A and Car B.

Decision Support, not Decisions

Like most good operational research, this should be treated as decision support

It’s not telling you the one ‘right’ answer

It’s just more robust evidence to add to

  • system knowledge
  • patient feedback
  • what’s actually deliverable

The best site on paper might be the one you can’t build on.

And once a service opens, demand you never knew about can appear.

Questions to Ask Your Analyst

Before you trust a map — or a ranking — some questions are always worth asking.

What was this optimised for — and who chose that?

Who did the model assume simply can’t be reached?

What travel mode, and what time of day, is this based on?

This colour is an average for the whole area. Who does it hide?

Would the answer change if the boundaries had been drawn differently?

What’s the second-best option — and how much worse is it, really?

You won’t remember all six. Remember the first: what was this optimised for, and who chose that?

The Location Optimization Playground

The scenario

You are a senior manager who has been given funding for one additional community diagnostic centre in Devon.

  • You have been told to improve access for those aged 50 to 84
  • …and to prioritise improving it for the most deprived areas
  • There are 4 existing centres, and 14 possible sites for the new one
  • People may only use centres within Devon — they can’t cross the border

You have been assigned a rather junior analyst.

They can get you information — but they can only follow very specific instructions, and their time is not unlimited.

How this works

Take the time to explore the maps.

Don’t worry about getting the “right” answer.

You’ll be asked to pick a site as you go. That’s deliberate — go with your gut each time, and don’t go back and tidy up your earlier answers.

Before You Begin

We will put you into breakout rooms in groups of 4-8.

Choose one ‘driver’, who will load the app and share their screen.

Everyone else feeds into making the choices.

45 minutes — countdown visible in your room.

If everyone opens the app separately, you’d each get your own progress, not a shared one — and that’s not going to work so well.

You might overload the app server too, so it would break for everyone!

So please only have one person open the app per group.

Debrief

So — where did you land?

Which site did your group choose?

Which briefings did you spend your time on?

Did your answer change as you went?

What didn’t you buy — and would it have changed your mind?

Same instinct as the questions from earlier — worth asking about every map you’re shown from now on, not just this one.

You didn’t disagree because somebody was wrong

There were 11 analyses your analyst could have run. You had 6 briefings.

So no two groups looked at the same evidence.

And every one of those analyses answers a different question.

Different evidence, different question, different site.

Nobody made a mistake.

What the optimiser found

It compared all 14 combinations against 5 different measures.

Several of them are defensible — nothing else beats them across the board. Each one is the best answer to a different question.

Then they found £5m down the back of the sofa

Funding for a second centre. 14 options becomes 91.

So we just open the two best sites from last time?

Sometimes

Sites compete for the same patients — so the best pair isn’t always your two best singles.

Here they happen to match on most measures. But not on worst-case journey time, where the best pair is a different one entirely.

The bit that actually matters

“I can just change one parameter and rerun it. Give me five minutes.”

Once the model exists, new questions are cheap.

The expensive part is building it once.

That’s what an HSMA project buys you — not one answer, but the ability to keep asking.

Geographic Showcase

What now?

We’re on the home stretch now!

Before we get you coming up with your own questions for potential HSMA’s from your organisations, let’s first look over some of the previous geographic projects HSMAs have taken on, ranging from the simple yet impactful to the complex.

Mapping of Hospice Demand and Assets

  • HSMA used their new mapping skills to map deprivation, referrals and hospice-related assets together

  • Contributed to a successful business case

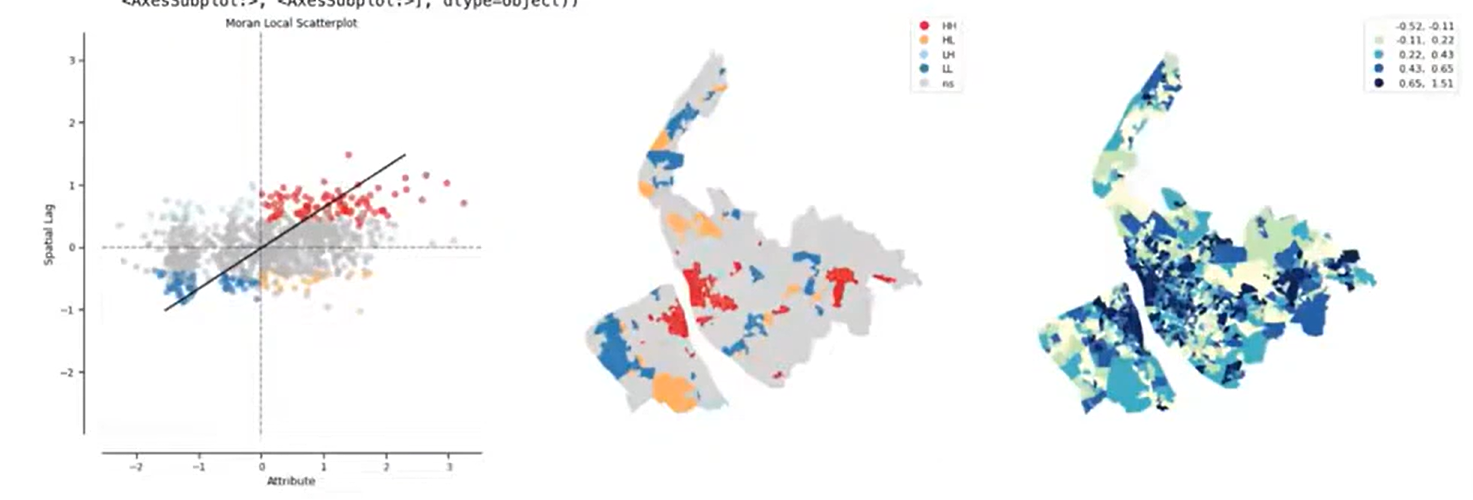
Mapping of Violent Crime

  • HSMAs used their skills to isolate hotspots of violent crime to target.
Cardiac Service Reorganisation

This project focussed on Reducing Travel Times to Treatment for Cardiac Patients in the South East of England

Neonatal Unit Modelling

Used Badgernet neonatal care database

22 sites

1200 possible locations for demand to come from

3 levels of care

Multi-objective optimisation, including

Minimising average travel time

Maximising proportion within 30 minutes

Maximising smallest number of admissions per year

Minimising largest number of admissions per year

Other Techniques

There are a few things we don’t teach and directly support on HSMA, but that HSMAs may be able to build up to using their geographic foundations.

We can support projects in these areas - but be aware that we might be bit more limited in the depth of advice we can provide.

Routing and Scheduling

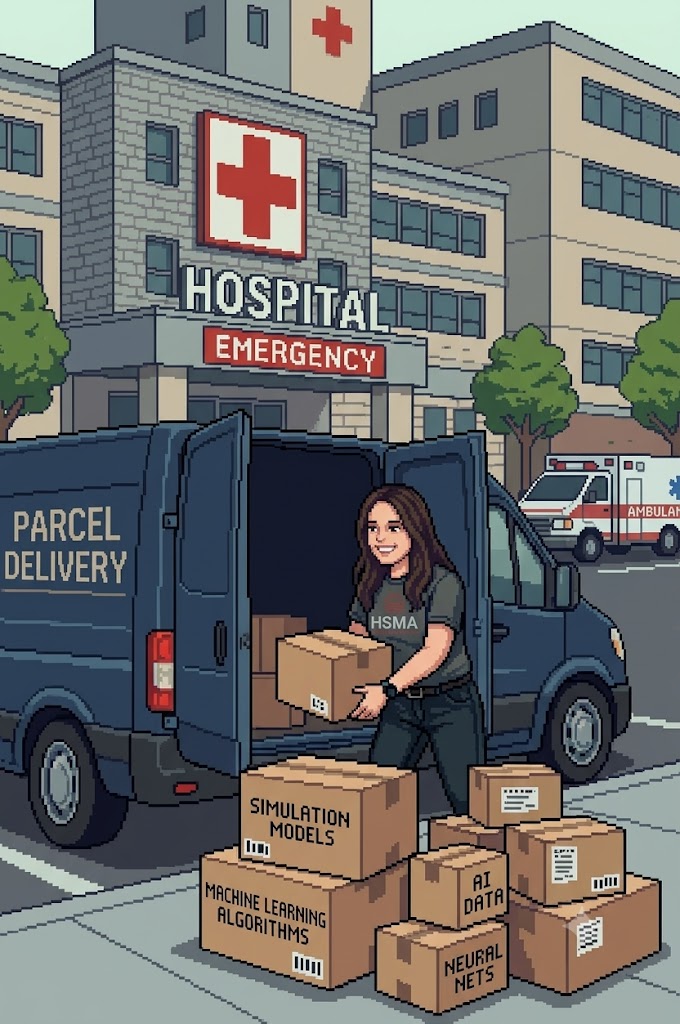
Most of us primarily encounter routing and scheduling in the context of parcel deliveries!

But there are potential applications in health data science projects too.

Efficient Routes

You may have heard of the ‘travelling salesman problem’ - where the goal is to find the most efficient route between a series of points.

This is actually a hard problem for computers to solve as the number of points increases - and even more so when you expand it to multiple vehicles (e.g. community nurses) with constraints (e.g. patient continuity, different skill mixes).

But computers are, overall, better at it than humans - and can do it at scale, automatically.

Don’ts of Routing Projects

While you could set up a project that will route your community nurses efficiently every day - we’d advise against it.

These kinds of tools are deceptively complex to create, particularly to ensure they run day in, day out, taking into account enough operational nuances.

This is one of the few places we would say ‘leave it to the software comparies’.

Do’s of Routing Projects

But routing and scheduling can still have a place in service improvement projects!

Maybe you want to look at the value of moving some of your patient transport vehicles, or adding another one.

Routing often pairs well with simulation for this kind of purpose - a technique we teach in another of our lambda workshops, and which students also learn on HSMA.

PenCHORD Project Showcase - Dialysis Transport during COVID-19

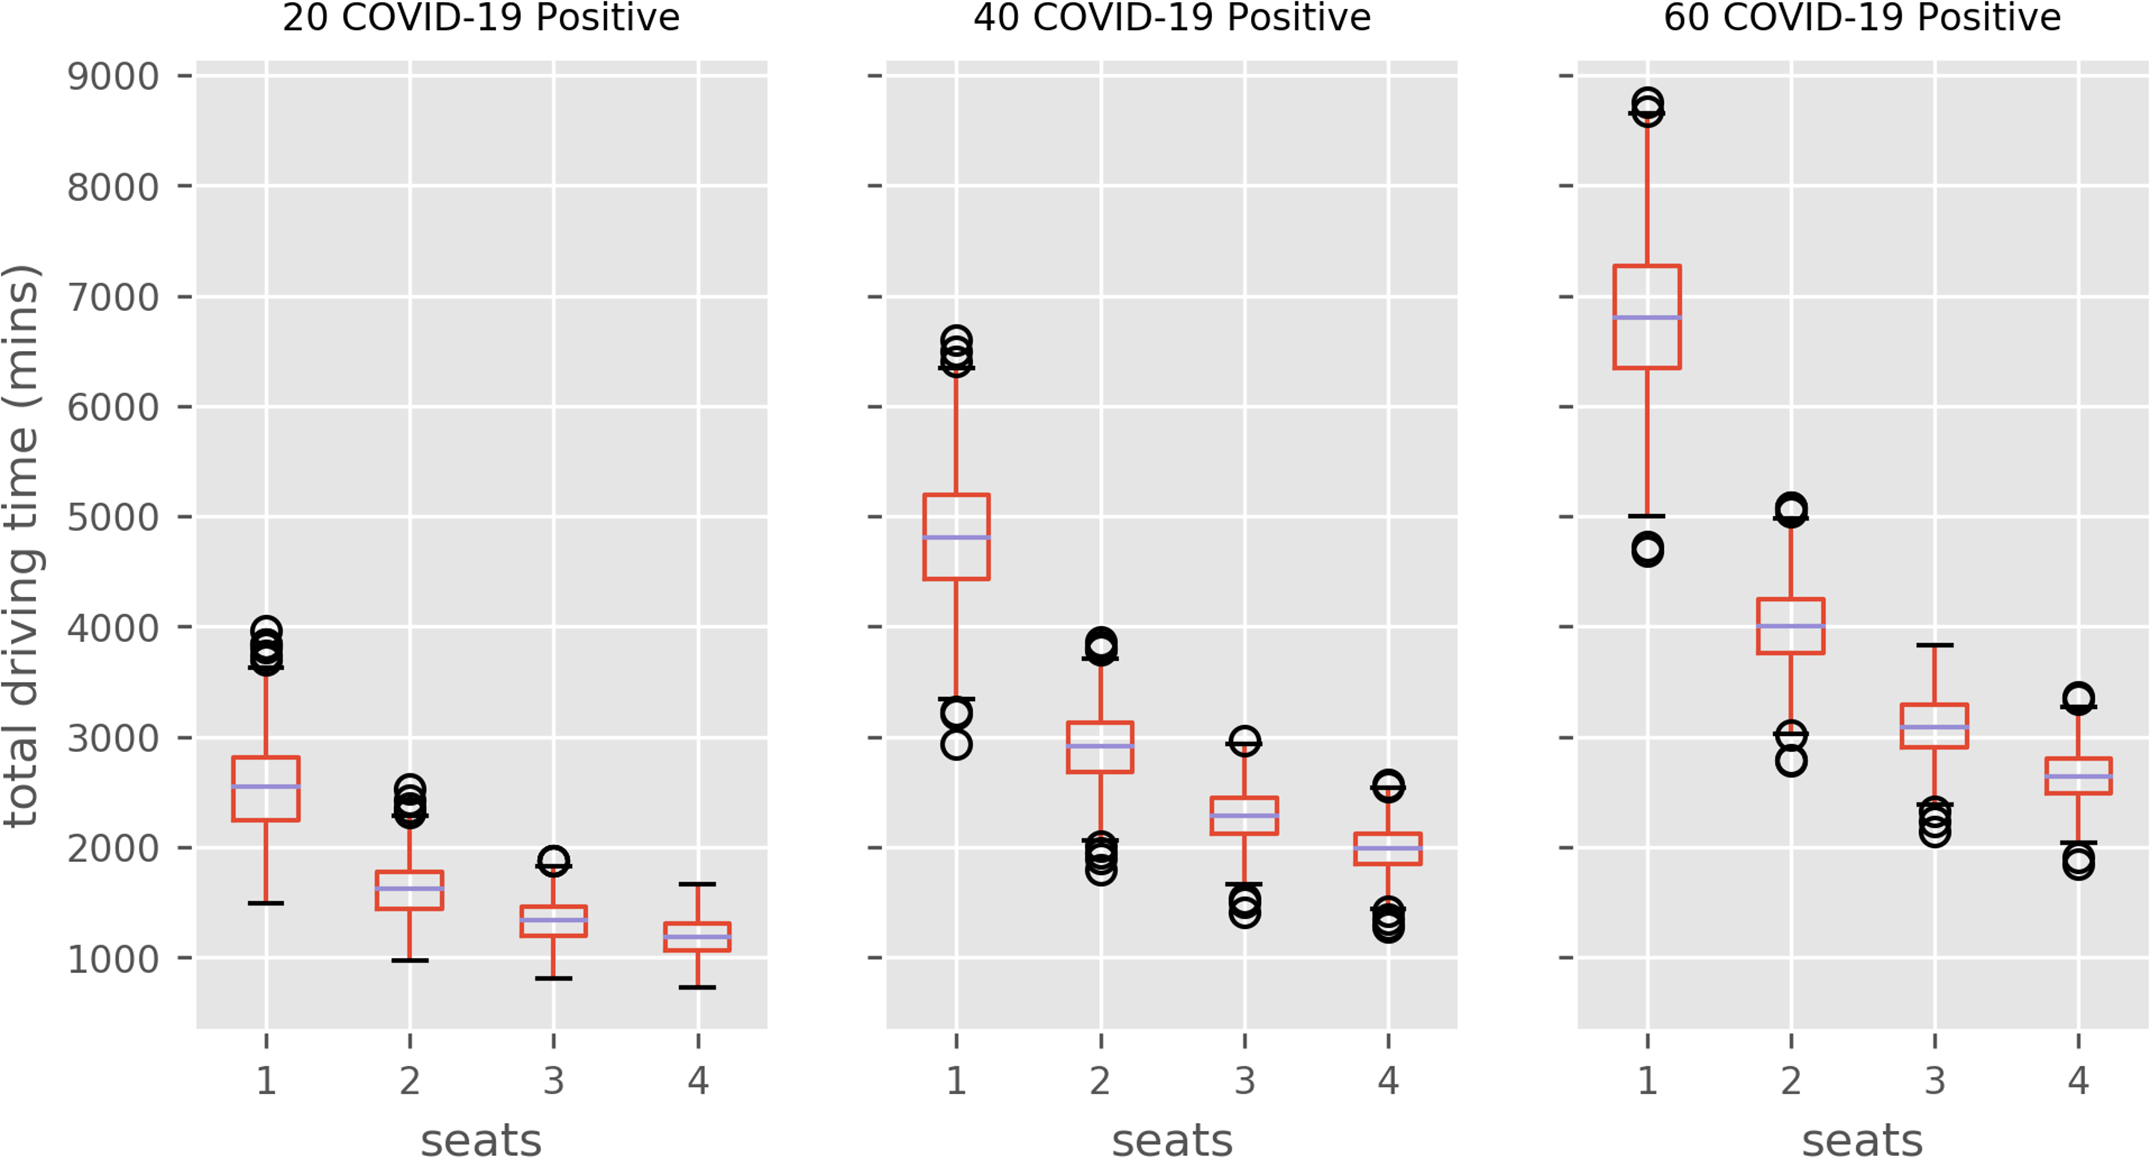
This PenCHORD project was tasked with making sure dialysis transport could continue safely and efficiently during the COVID-19 Pandemic.
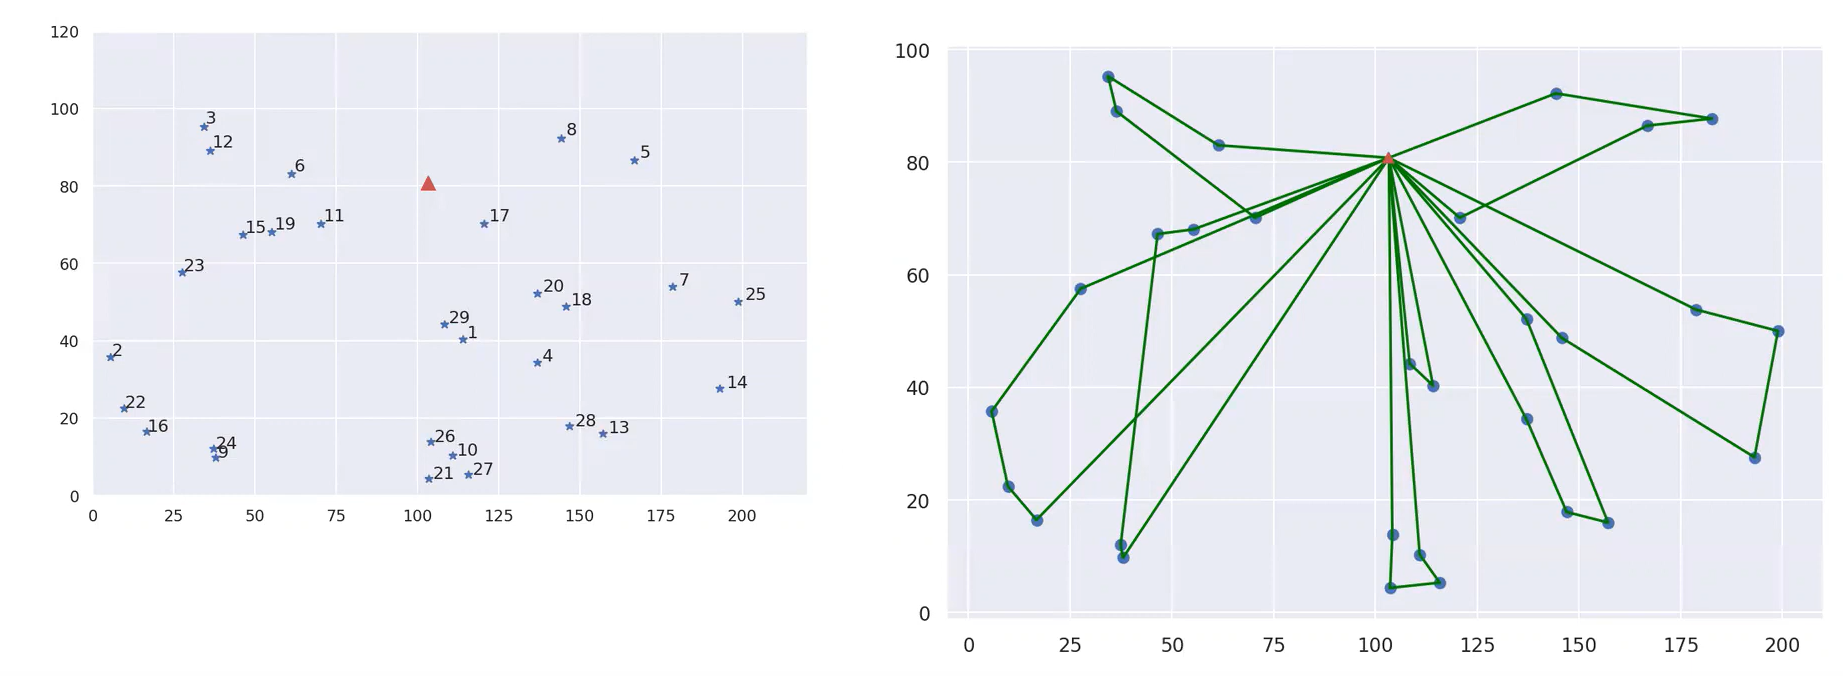
By combining simulation of patient disease status with routing, they were able to show the impact of different patients-per-vehicle limits on overall driving time required.

PenCHORD Project Showcase - Dialysis Transport during COVID-19

Modelling multiple disease spread scenarios, they were able to show a significant reduction in travel hours required by relaxing policies to allow two patients to travel in the same vehicle simultaneously, balancing infection control needs with limited resource and essential treatments.
Boundary Optimization

Boundaries appear frequently in healthcare services.

Perhaps you use them to determine which of several sub-teams a patient will be allocated to when they are referred - e.g. for community physio teams, or community mental healthcare or crisis care.

But how were those boundaries drawn?

Are they actually dividing work in a fair and efficient way?

When were they last updated?

Boundary Optimization

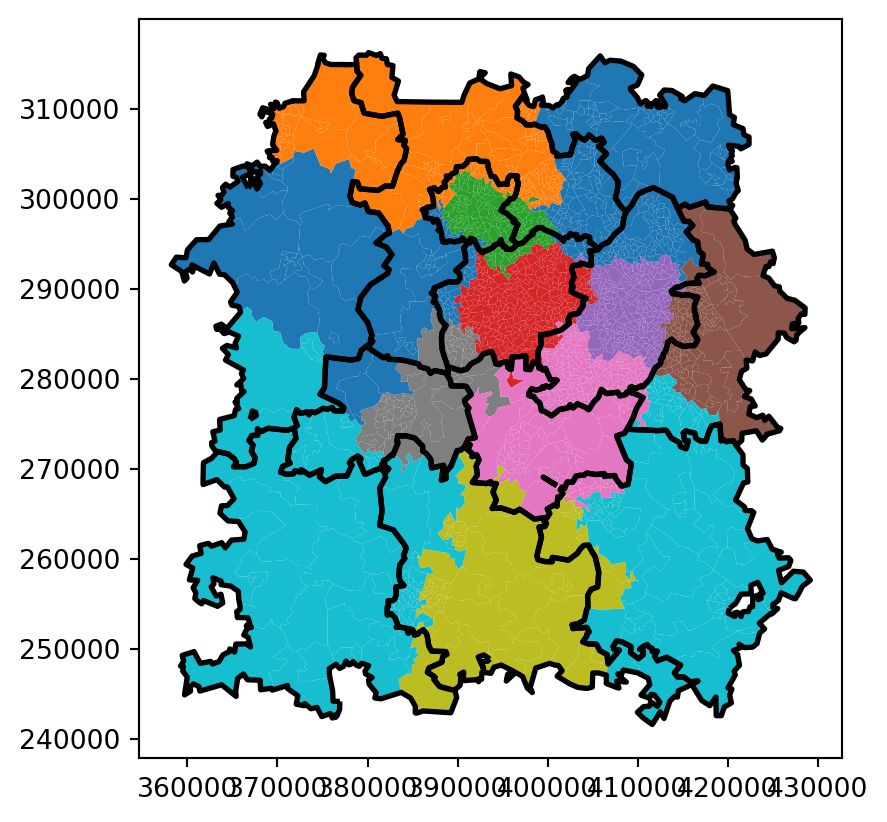
Boundary optimization algorithms, a bit like location optimization - can help you redraw boundaries in a way that is fairer.

They can try out hundreds of thousands of combinations, scoring against metrics like balance of assigned workload across regions, or how much the region differs from an ideal workload per team.
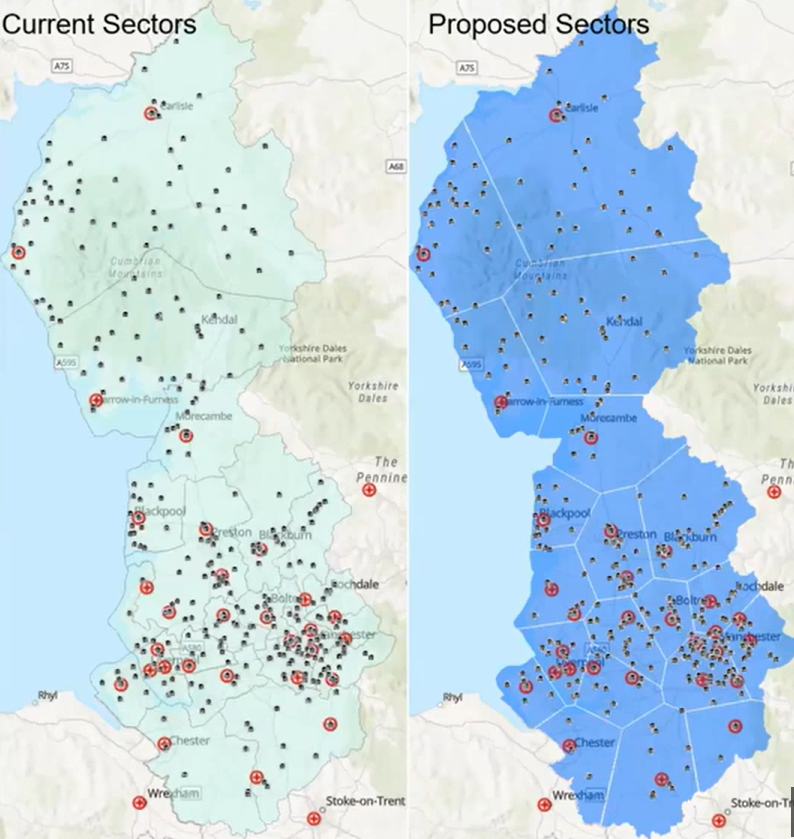
HSMA Project Showcase - Boundary Optimization for North West Ambulance Service

The North West Ambulance service used advanced location optimization approaches to update historic ambulance dispatch boundaries, which were now imbalanced and inefficient after population shifts since their original setup.
Final Exercise

Project Planning

Now you know more about what it’s possible to achieve, review your list of geographical problems from earlier.

Are there other things you’d plan now you know more about the techniques available?

What projects would you propose for HSMAs from your organisation to work on? Use the following prompts to draft your proposals.

Summarise your problem in one sentence

Classify the problem: is it location optimisation (adding, removing or designing from scratch), routing, scheduling, etc.

What decision would the project inform?

What would the potential impact on patients, staff or services be? (e.g. money saving, better access, reduced waits, etc.)

Next Steps

Today’s Goals — Revisited

Six questions, back at the start of the day:

What questions can these methods be used to answer?

How do the methods work, at a high level?

How do I interact with and interpret these models?

What problems in my own organisation can these answer?

What can we tackle together?

Who can I send from my organisation to learn these skills?

You’ve spent a day answering all six. What’s left is turning that into paperwork — which starts now.

Before HSMA 7

Liaise with people in your organisation to identify candidates for the HSMA Programme.

Record your proposal in our online database, receiving a proposal number.

All proposals will be visible to others on the Lambda programme as others may have the same issues and want to link up.

When applicants apply to the programme, they will be asked if their nomination has come via HSMA-Lambda.

They should answer YES, and provide the project proposal ID for your proposal(s).

Proposal Recording Website

During HSMA 7

When work on your project begins (after Phase 1 of the HSMA training), you will be notified.

You will be invited to monthly forums to hear updates on the project work (as well as other projects in the programme).

You will also be invited to an end of programme showcase presentation of the work

After HSMA 7

After completion of the project, we’ll follow up with you to see what happened as a result of the work. This is important for us as we need to capture impact from our work.